signal strength 2 of 5
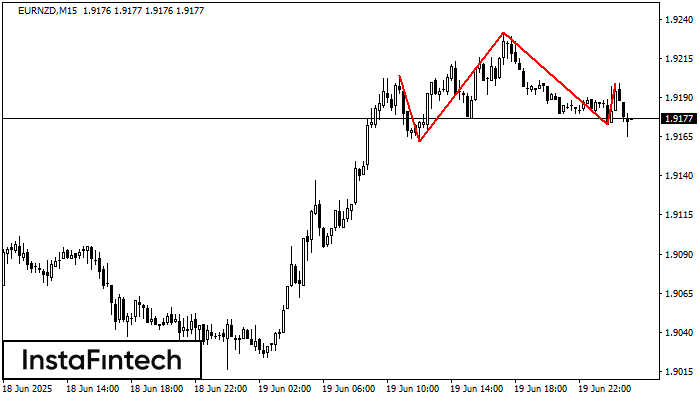
The EURNZD M15 formed the Head and Shoulders pattern with the following features: The Head’s top is at 1.9232, the Neckline and the upward angle are at 1.9162/1.9173. The formation of this pattern can bring about changes in the current trend from bullish to bearish. In case the pattern triggers the expected changes, the price of EURNZD will go towards 1.9151.
The M5 and M15 time frames may have more false entry points.
- All
- Double Top
- Flag
- Head and Shoulders
- Pennant
- Rectangle
- Triangle
- Triple top
- All
- #AAPL
- #AMZN
- #Bitcoin
- #EBAY
- #FB
- #GOOG
- #INTC
- #KO
- #MA
- #MCD
- #MSFT
- #NTDOY
- #PEP
- #TSLA
- #TWTR
- AUDCAD
- AUDCHF
- AUDJPY
- AUDUSD
- EURCAD
- EURCHF
- EURGBP
- EURJPY
- EURNZD
- EURRUB
- EURUSD
- GBPAUD
- GBPCHF
- GBPJPY
- GBPUSD
- GOLD
- NZDCAD
- NZDCHF
- NZDJPY
- NZDUSD
- SILVER
- USDCAD
- USDCHF
- USDJPY
- USDRUB
- All
- M5
- M15
- M30
- H1
- D1
- All
- Buy
- Sale
- All
- 1
- 2
- 3
- 4
- 5
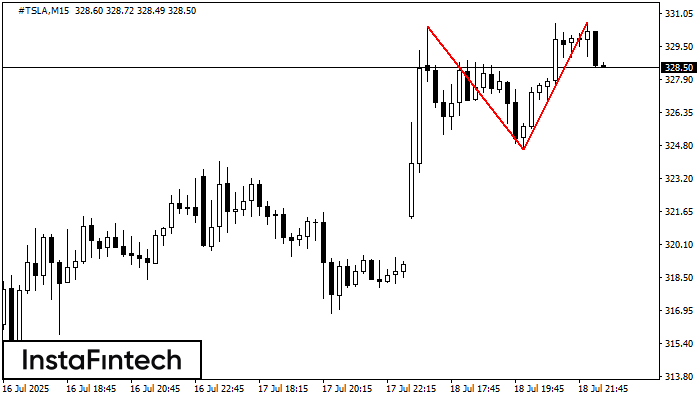
El patrón de reversión Doble Techo ha sido formado en #TSLA M15. Características: el límite superior 330.45; el límite inferior 324.60; el ancho del patrón es 603 puntos. Es mejor
Los marcos de tiempo M5 y M15 pueden tener más puntos de entrada falsos.
Open chart in a new window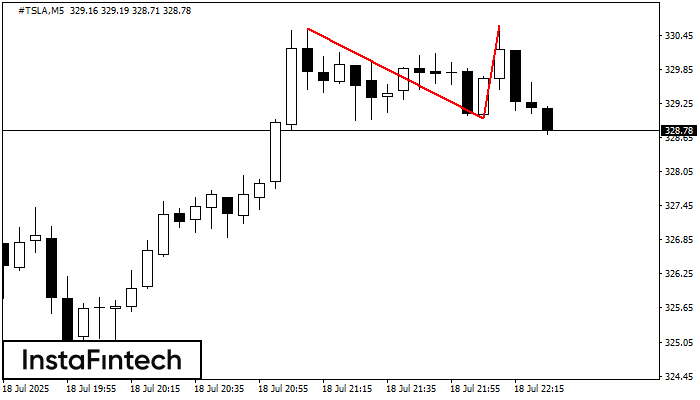
El patrón Doble Techo ha sido formado en #TSLA M5. Esto señala que la tendencia ha sido cambiada de alcista a bajista. Probablemente, si la base del patrón 328.99
Los marcos de tiempo M5 y M15 pueden tener más puntos de entrada falsos.
Open chart in a new window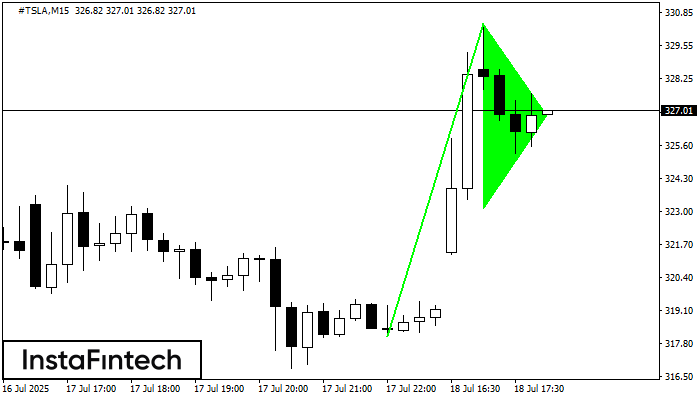
La señal Banderín alcista – Instrumento de negociación #TSLA M15, patrón de continuación. Pronóstico: es posible establecer una posición de compra por encima del alza del patrón de 330.45
Los marcos de tiempo M5 y M15 pueden tener más puntos de entrada falsos.
Open chart in a new window