empty
10.02.2022 05:27 AM
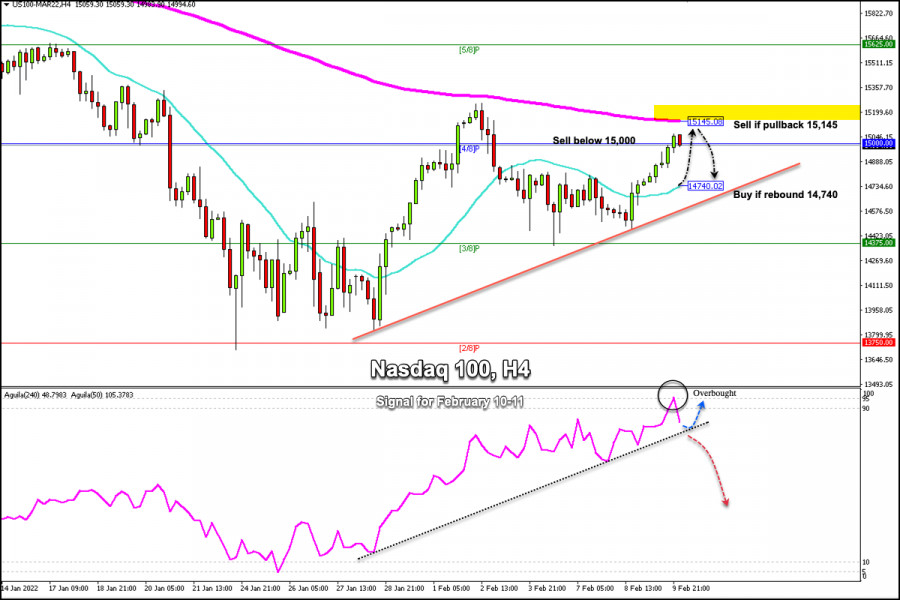
Trading signals for Nasdaq-100 (#NDX) on February 10-11, 2022: sell below 15,000 (4/8)

This image is no longer relevant

The Nasdaq-100 Tech Index (#NDX) is trading below the 200 EMA and right at the psychological level of 15,000 points.

Nasdaq-100 accumulates a strong upward trend nine days straight. A downward correction is likely in the coming days because it is showing signs of exhaustion.

EMA 200 (15,145) is likely to be a strong resistance for the Nasdaq-100. If the bullish force continues and tests this resistance there could be a technical rejection.

The eagle indicator is showing overbought levels and a technical correction is likely in the next few hours due to the moving average touching the mark of 95-point.

Early in the American session, US inflation data is due to be released and there is likely to be strong volatility across all Wall Street indices.

The main trend is downward according to the daily chart. However, the ongoing upward move has a barrier at the strong resistance of 15,145 (200 EMA). As long as it remains below this level, we can expect the resumption of the dominant trend.

A trade through 15,200 will change the main trend to the upside and we could expect a strong move higher towards the level 15,625 (5/8).

On the other hand, a sharp break below the 21 SMA located at 14,740 and a break of the trend channel could cause an acceleration to the downside towards the support 3/8 Murray at 14,375 (3/8) and up to 13,750 (2/8).

Support and Resistance Levels for February 10 - 11, 2022

Resistance (3) 15,499

Resistance (2) 15,287

Resistance (1) 15,176

----------------------------

Support (1) 14,852

Support (2) 14,640

Support (3) 14,528

***********************************************************


Scenario

Timeframe H4

Recommendation: sell below o if pullback

Entry Point 15,000; 15,145

Take Profit 14,800; 14,740

Stop Loss 15,080; 15,225

Murray Levels 13,750 (2/8), 14,375,(3/8), 15,000 (4/8), 15,625 (5/8)

***************************************************************************

Dimitrios Zappas,
انسٹافاریکس کا تجزیاتی ماہر
© 2007-2025
ٹائم فریم منتخب کریں
5
منٹ
15
منٹ
30
منٹ
1
گھنٹہ
4
گھنٹے
1
دن
1
ہفتہ
انسٹافاریکس کے ساتھ کرپٹو کرنسی کی معاملاتی تبدیلیوں سے کمائیں۔
میٹا ٹریڈر 4 ڈاؤن لوڈ کریں اور اپنی پہلی ٹریڈ کھولیں۔
  • Grand Choice
    Contest by
    InstaForex
    InstaForex always strives to help you
    fulfill your biggest dreams.
    مقابلہ میں شامل ہوں

تجویز کردہ مضامین

اسرائیل ایران جنگ کے درمیان امریکی مارکیٹ

ایس اینڈ پی 500 جائزہ – 16 جون امریکی مارکیٹ اسرائیل–ایران جنگ کے تناظر میں جمعہ کے روز اہم امریکی انڈیکس میں کمی دیکھنے کو ملی: ڈاؤ -1.8%،

Jozef Kovach 15:45 2025-06-16 UTC+2

جاب رپورٹ کی بنا پر امریکی مارکیٹ میں تیزی آئی ہے

ایس اینڈ پی 500 9 جون کا جائزہ نان فارم پے رولز ڈیٹا پر امریکی مارکیٹ میں ریلیاں جمعہ کو امریکی اہم اشاریے: ڈآو +1%، نیسڈک +1.2%، ایس اینڈ

Jozef Kovach 19:24 2025-06-10 UTC+2

مارکیٹ اپنے عروج کے قریب ہے: حتمی اضافہ یا نیا پل بیک؟

سرمایہ کار تیزی سے اپنے نیچے کی بنیاد میں دراڑیں محسوس کر رہے ہیں۔ اس ہفتے ٹرمپ انتظامیہ کی جانب سے بڑے پیمانے پر مالیاتی پیکج کی منظوری

Anna Zotova 13:46 2025-05-23 UTC+2

مئی 08 کو امریکی اسٹاک مارکیٹ کی تازہ کاری۔ فیڈ کی پالیسی میٹنگ کے بعد ایس پی 500 اور نیسڈک میں اضافہ

امریکی بینچ مارک اسٹاک انڈیکس نے پچھلے باقاعدہ سیشن کو فائدہ کے ساتھ بند کیا۔ ایس اینڈ پی 500 میں 0.43% اضافہ ہوا، نیسڈک 100 میں 0.27% اضافہ ہوا،

Jakub Novak 16:57 2025-05-08 UTC+2

امریکی مارکیٹ: معمولی لیکن مثبت موو

ایس اینڈ پی 500 2 مئی کا خلاصہ امریکی مارکیٹ میں معمولی لیکن مستحکم اضافہ دیکھا گیا۔ جمعہ کو، اہم امریکی انڈیکس مثبت علاقے میں بند ہوئے: ڈاؤ جونز

Jozef Kovach 20:13 2025-05-02 UTC+2

امریکی مارکیٹ: جی ڈی پی سکڑتا ہے، لیکن وال اسٹریٹ چڑھتا ہے۔

ایس اینڈ پی 500 یکم مئی کا جائزہ جی ڈی پی معاہدے، لیکن امریکی مارکیٹ چڑھتی ہے جمعہ کے دن اہم امریکی اشاریے: Dow +0.4%، NASDAQ -0.1%، S&P 500 +0.2%،

Jozef Kovach 20:56 2025-05-01 UTC+2

ٹرمپ نے چین پر دباؤ کم کیا۔

#ایس پی ایکس کے 24 گھنٹے کے چارٹ پر لہر کا نمونہ عام طور پر واضح ہوتا ہے۔ عالمی پانچ لہروں کا ڈھانچہ چھوٹے پیمانے پر ٹرمینل اسکرین

Chin Zhao 16:59 2025-04-24 UTC+2

اپریل 21 کے لیے اسٹاک مارکیٹ کی تازہ کاری: نئی افواہوں کے درمیان ایس اینڈ پی 500 اور نیسڈک کی دوبارہ کمی

پچھلے باقاعدہ سیشن کے اختتام پر، امریکی اسٹاک انڈیکس ملے جلے طور پر ختم ہوئے۔ ایس اینڈ پی 500 میں 0.13% اضافہ ہوا، جبکہ نیسڈک 100 میں 0.13%

Jakub Novak 14:43 2025-04-21 UTC+2

ٹیرف بڑی تنزلی کی بجائے اضآفہ کا سبب کیون بن سکتا ہے؟

analytics67eba881aef30.jpg مارکیٹوں میں موجودہ گھبراہٹ بہت زیادہ ہو سکتی ہے۔ اگر کل کے ٹیرف توقع سے کم نقصان دہ ثابت ہوتے ہیں، تو ہم ایک مختصر لیکن تیز رفتار بحالی

Anna Zotova 16:05 2025-04-01 UTC+2

1 اپریل کو امریکی اسٹاک مارکیٹ میں اپ ڈیٹ۔ SP500 اور NASDAQ ایک سال کی کم ترین سطح پر گر گئے

جمعہ کے باقاعدہ سیشن کے نتیجے میں، امریکی اسٹاک انڈیکس ملے جلے بند ہوئے۔ S&P 500 میں 0.55% اضافہ ہوا، جبکہ Nasdaq 100 میں 0.14% کی کمی ہوئی۔ صنعتی

Jakub Novak 11:46 2025-04-01 UTC+2
ابھی فوری بات نہیں کرسکتے ؟
اپنا سوال پوچھیں بذریعہ چیٹ.
Widget callback
 

Dear visitor,

Your IP address shows that you are currently located in the USA. If you are a resident of the United States, you are prohibited from using the services of InstaFintech Group including online trading, online transfers, deposit/withdrawal of funds, etc.

If you think you are seeing this message by mistake and your location is not the US, kindly proceed to the website. Otherwise, you must leave the website in order to comply with government restrictions.

Why does your IP address show your location as the USA?

  • - you are using a VPN provided by a hosting company based in the United States;
  • - your IP does not have proper WHOIS records;
  • - an error occurred in the WHOIS geolocation database.

Please confirm whether you are a US resident or not by clicking the relevant button below. If you choose the wrong option, being a US resident, you will not be able to open an account with InstaForex anyway.

We are sorry for any inconvenience caused by this message.