Analyzing trades on Monday
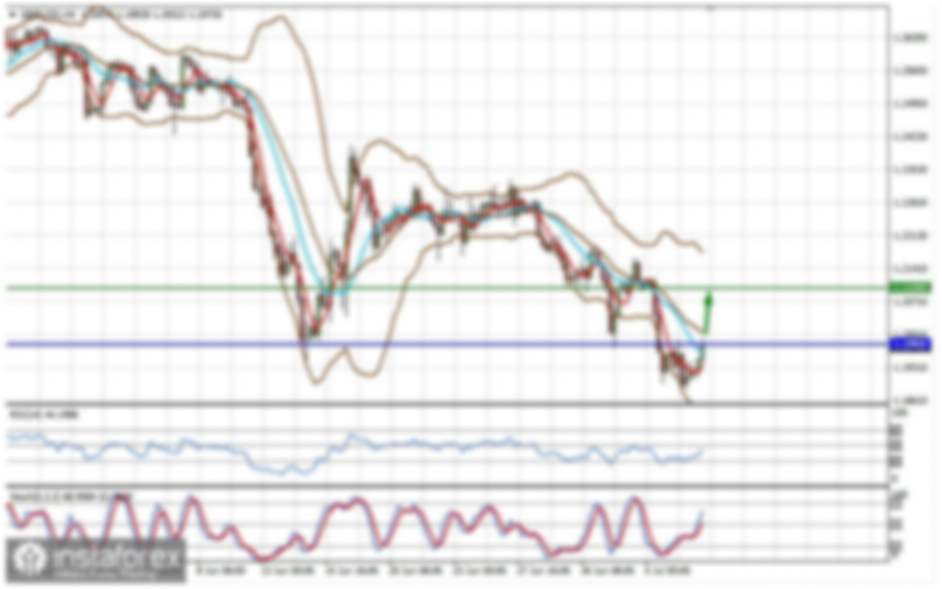
EUR/USD on M30 chart
The EUR/USD pair was trading steadily on Monday, resuming the downward movement at the same time. In the course of the session, the pair broke through the level of 1.1259, from which it had rebounded twice before that. Thus, the bears confirmed the continuation of the downward movement. At the moment, the nearest target is located at the level of 1.1192. Unfortunately, a couple of days ago, the descending trendline was canceled, but the downtrend remained in place. So, today the pair has formed a downtrend channel which supports the bearish trend. On Monday, not a single important report was published either in the US or the EU. Thus, the fundamental and macroeconomic backgrounds were not relevant today, and the markets had nothing to react to. However, the fact that the euro continued to fall amid neutral background speaks of a clear bearish sentiment in the market.
EUR/USD on M5 chart
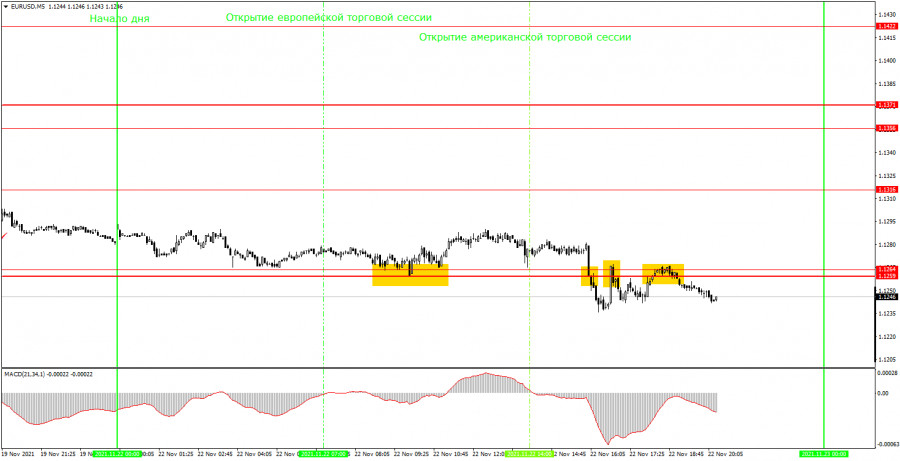
On the 5-minute time frame, the technical picture on Friday was almost perfect which cannot be said about Monday. During the day, four trading signals were formed around the 1.1259-1.1264 area. Thus, it was necessary to follow them one by one. Yet, the first two trading signals turned out to be false and, therefore, all subsequent signals should not have been considered. Still, let's take a look at them. The rebound from the above mentioned area during the European session was a buy signal. But the pair managed to advance by only 20 pips. Therefore, Stop Loss was set at breakeven and a buy trade was closed after triggering it. Further, a sell signal was generated when the price consolidated below the area of 1.1259 - 1.1264. However, even in this case, the downward movement did not continue, and the position was closed by the Stop Loss order at a breakeven point. The next two signals, as I have already mentioned, should not have been followed as they turned out to be false. Thus, the first trading day of the week ended with no profit and no loss either.
Trading tips for Tuesday
On the 30-minute time frame, the downtrend resumed thanks to a new descending channel. Thus, the downward movement is likely to continue. Therefore, selling the instrument should be a priority in any trading system. On the 5-minute time frame, the key levels for November 23 are located at 1.1192, 1.1259 - 1.1264, 1.1316, 1.1356, and 1.1371. Take Profit should be set at a distance of 30-40 points. Stop Loss should be placed to a breakeven point as soon as the price passes 15 pips in the right direction. On the M5 chart, the nearest level could serve as a target unless it is located too close or too far away. If it is, then you should act according to the situation or trade with a Take Profit. On Tuesday, novice traders can pay attention to reports on business activity in the US and the EU. Yet, this data is unlikely to stir the markets since this indicator is not considered crucial for tracking the economic state of a country. At the same time, price fluctuations are possible if the reading differs greatly from forecasts.
Basic rules of the trading system
1) The signal strength is determined by the time the signal took to form (a bounce or a breakout of the level). The quicker it is formed, the stronger the signal is.
2) If two or more positions were opened near a certain level based on false signals (which did not trigger a Take Profit or test the nearest target level), then all subsequent signals at this level should be ignored.
3) When trading flat, a pair can form multiple false signals or not form them at all. In any case, it is better to stop trading at the first sign of a flat movement.
4) Trades should be opened in the period between the start of the European session and the middle of the US trading hours when all positions must be closed manually.
5) You can trade using signals from the MACD indicator on the 30-minute time frame only given that volatility is strong and there is a clear trend that should be confirmed by a trend line or a trend channel.
6) If two levels are located too close to each other (from 5 to 15 pips), they should be considered support and resistance levels.
On the chart
Support and Resistance Levels are the levels that serve as targets when buying or selling the pair. You can place Take Profit near these levels.
Red lines are channels or trend lines that display the current trend and show in which direction it is better to trade now.
The MACD indicator (14, 22, and 3) consists of a histogram and a signal line. When they cross, this is a signal to enter the market. It is recommended to use this indicator in combination with trend patterns (channels and trend lines).
Important announcements and economic reports that you can always find on the economic calendar can seriously influence the trajectory of a currency pair. Therefore, at the time of their release, we recommend trading as carefully as possible or exiting the market in order to avoid sharp price fluctuations.
Beginners on Forex should remember that not every single trade has to be profitable. The development of a clear strategy and money management is the key to success in trading over a long period of time.