empty
09.12.2022 09:56 AM
EUR/USD and GBP/USD trading plan and analysis for beginners on December 9, 2022

Economic calendar on December 8

Yesterday's employment data from the US showed that weekly jobless claims went up in contrast to a forecast predicting a decline. This is a negative factor for the US labor market which served as a catalyst for selling the US dollar.

Statistical data:

Continuing jobless claims increased to 1,671K from 1,609K.

Initial jobless claims went up to 230K from 226K.

Overview of technical charts on December 8

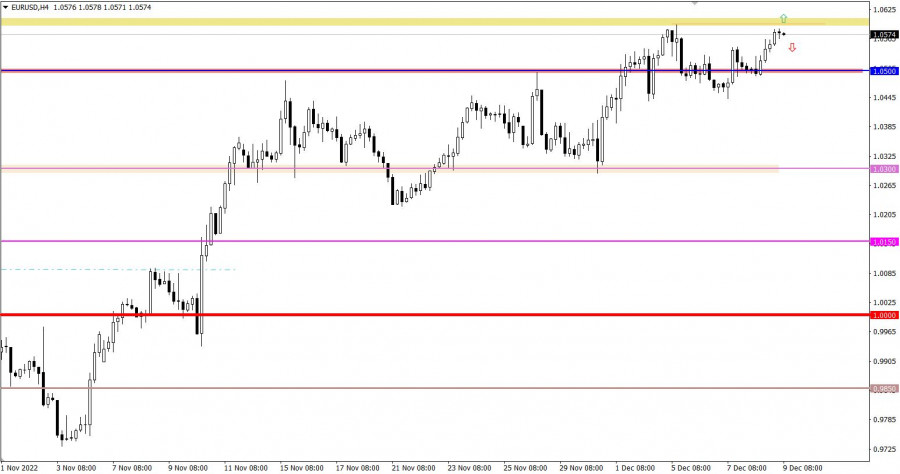
After breaking above the mark of 1.0550, the euro extended its rise against the US dollar. So, the European currency managed to regain almost 100% of its losses after the recent correction from the resistance level of 1.0600.

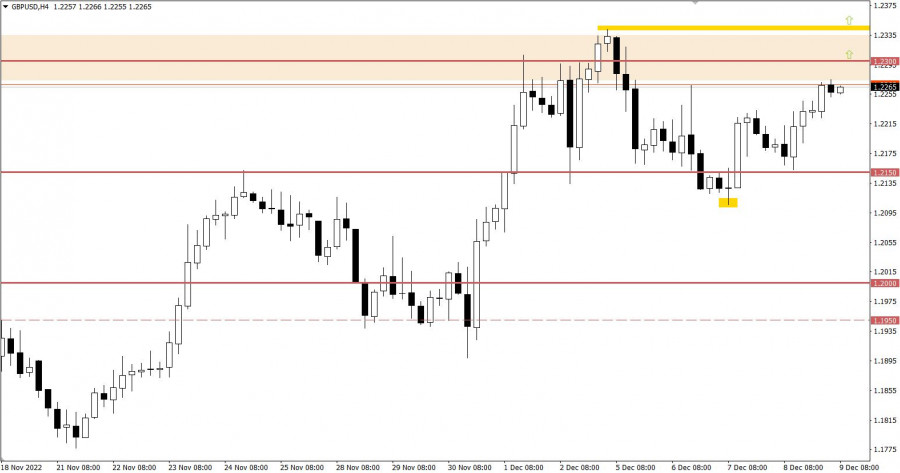
GBP/USD accelerated its advance after settling above the level of 1.2200. This allowed traders to add more long positions so that the pair gradually recovered after the recent pullback.

This image is no longer relevant

Economic calendar on December 9

Today, the US will publish the data on the producer price index which is expected to decline to 5.9% from 6.7%. This will be a signal that inflation is slowing down. If so, the US dollar sell-off may intensify amid expectations that the Fed will raise the rate by 50 instead of 75 basis points at its meeting in December.

Timing

Producer Price Index – 13:30 GMT

EUR/USD trading plan on December 9

If the price holds above 1.0600 at least on the H4 timeframe, the pair may extend its downtrend from the current low. This will signal a change in the market sentiment in the medium term.

Alternatively, a rebound from the level of 1.0600 is possible. If so, the volume of short positions may gradually increase thus causing a reversal in the trend.

This image is no longer relevant

GBP/USD trading plan on December 9

A steady hold above the 1.2300 level on the 4-hour chart may pave the way toward the local high of 1.2343. This move will indicate a change in the market sentiment in the medium term.

In a different scenario, the price may rebound from 1.2300/1.2343, encouraging the bears to add more short positions at the start of the next week.

This image is no longer relevant

What's on the charts

The candlestick chart type is white and black graphic rectangles with lines above and below. With a detailed analysis of each individual candle, you can see its characteristics relative to a particular time frame: opening price, closing price, intraday high and low.

Horizontal levels are price coordinates, relative to which a price may stop or reverse its trajectory. In the market, these levels are called support and resistance.

Circles and rectangles are highlighted examples where the price reversed in history. This color highlighting indicates horizontal lines that may put pressure on the asset's price in the future.

The up/down arrows are landmarks of the possible price direction in the future.

Gven Podolsky,
انسٹافاریکس کا تجزیاتی ماہر
© 2007-2025
ٹائم فریم منتخب کریں
5
منٹ
15
منٹ
30
منٹ
1
گھنٹہ
4
گھنٹے
1
دن
1
ہفتہ
انسٹافاریکس کے ساتھ کرپٹو کرنسی کی معاملاتی تبدیلیوں سے کمائیں۔
میٹا ٹریڈر 4 ڈاؤن لوڈ کریں اور اپنی پہلی ٹریڈ کھولیں۔
  • Grand Choice
    Contest by
    InstaForex
    InstaForex always strives to help you
    fulfill your biggest dreams.
    مقابلہ میں شامل ہوں

تجویز کردہ مضامین

4 جولائی کو برطانوی پاؤنڈ/امریکی ڈالر کے پیئر کی تجارت کیسے کی جائے؟ نئے افراد کے لیے آسان تجاویز اور تجارتی تجزیہ

جمعرات کی تجارت کا تجزیہ برطانوی پاؤنڈ/امریکی ڈالر کا 1گھنٹے کا چارٹ جمعرات کو، برطانوی پاؤنڈ/امریکی ڈالر کی جوڑی ایک بار پھر گر گئی، لیکن اس بار برطانوی کرنسی

Paolo Greco 12:46 2025-07-04 UTC+2

4 جولائی کو یورو/امریکی ڈالر کے جوڑے کی تجارت کیسے کی جائے؟ نئے افراد کے لیے آسان تجاویز اور تجارتی تجزیہ

یو ایس نان فارم پے رولز اور بے روزگاری کے اعداد و شمار کی اشاعت سے پہلے اور بعد میں، یورو/امریکی ڈالر کرنسی کے جوڑے نے جمعرات کو تجارت کی۔

Paolo Greco 12:46 2025-07-04 UTC+2

4 جولائی کو برطانوی پاؤنڈ/امریکی ڈالر کے لیے تجارتی سفارشات اور تجزیہ: ڈالر میں اضافہ ہوا — اور پھر دوبارہ گرا

برطانوی پاؤنڈ/امریکی ڈالر کا 5 منٹ کا تجزیہ جمعرات کو برطانوی پاؤنڈ/امریکی ڈالر کرنسی کے جوڑے نے یورو/امریکی ڈالر کے جوڑے میں تقریباً ایک جیسی حرکت دکھائی۔ یہ حیرت

Paolo Greco 12:43 2025-07-04 UTC+2

4 جولائی کو یورو/امریکی ڈالر کے لیے تجارتی سفارشات اور تجزیہ: امریکی یوم آزادی

یورو/امریکی ڈالر کا 5 منٹ کا تجزیہ یورو/امریکی ڈالر کرنسی کے جوڑے نے جمعرات کو کافی واضح طور پر تجارت کی۔ دن کے بیشتر حصے میں، ہم نے کم اتار

Paolo Greco 12:41 2025-07-04 UTC+2

یورو / یو ایس ڈی: 3 جولائی کو امریکی سیشن کے لیے تجارتی منصوبہ (صبح کی تجارت کا جائزہ)

اپنی صبح کی پیشین گوئی میں، میں نے 1.1784 کی سطح کو مارکیٹ میں داخلے کے لیے کلیدی حوالہ نقطہ کے طور پر اجاگر کیا۔ آئیے 5 منٹ کے چارٹ

Miroslaw Bawulski 15:43 2025-07-03 UTC+2

جی بی پی / یو ایس ڈی: 3 جولائی کو امریکی سیشن کے لیے تجارتی منصوبہ (صبح کی تجارت کا جائزہ)

میری صبح کی پیشن گوئی میں، میں نے 1.3659 کی سطح پر توجہ مرکوز کی اور اس کی بنیاد پر تجارتی فیصلے کرنے کا منصوبہ بنایا۔ آئیے

Miroslaw Bawulski 15:36 2025-07-03 UTC+2

3 جولائی کو برطانوی پاؤنڈ/امریکی ڈالر کے پیئر کی تجارت کیسے کی جائے؟ نئے افراد کے لیے آسان تجاویز اور تجارتی تجزیہ

بدھ کو، برطانوی پاؤنڈ/امریکی ڈالر کا جوڑا فلک بوس عمارت سے گرے پتھر کی طرح ڈوب گیا، جس سے کرنسی کے تجزیہ کاروں کو فوری

Paolo Greco 13:40 2025-07-03 UTC+2

3 جولائی کو یورو/امریکی ڈالر کے جوڑے کی تجارت کیسے کی جائے؟ نئے افراد کے لیے آسان تجاویز اور تجارتی تجزیہ

بدھ کو، یورو/امریکی ڈالر کرنسی کے جوڑے نے نیچے کی طرف اصلاح کا ایک نیا دور شروع کرنے کی کوشش کی، اور اس کوشش کا نتیجہ کسی بھی ٹائم فریم

Paolo Greco 13:39 2025-07-03 UTC+2

3 جولائی کو برطانوی پاؤنڈ/امریکی ڈالر کے لیے تجارتی سفارشات اور تجزیہ: نئی ریلی کی خاطر ہیرا پھیری؟

برطانوی پاؤنڈ/امریکی ڈالر کا 5 منٹ کا تجزیہ بدھ کو، برطانوی پاؤنڈ/امریکی ڈالر کرنسی جوڑا بغیر کسی واضح وجہ کے کریش ہو گیا۔ برطانیہ یا امریکہ میں کوئی ایسی

Paolo Greco 13:34 2025-07-03 UTC+2

3 جولائی کو یورو/امریکی ڈالر کے لیے تجارتی سفارشات اور تجزیہ: یورو برقرار ہے، پاؤنڈ گر گیا

بدھ کو، یورو/امریکی ڈالر کرنسی کے جوڑے میں قدرے کمی آئی لیکن عام طور پر برطانوی پاؤنڈ کی پیروی کرنے کے لیے کوئی جھکاؤ نہیں دکھایا، جو تقریباً 200 پوائنٹس

Paolo Greco 13:33 2025-07-03 UTC+2
ابھی فوری بات نہیں کرسکتے ؟
اپنا سوال پوچھیں بذریعہ چیٹ.
Widget callback
 

Dear visitor,

Your IP address shows that you are currently located in the USA. If you are a resident of the United States, you are prohibited from using the services of InstaFintech Group including online trading, online transfers, deposit/withdrawal of funds, etc.

If you think you are seeing this message by mistake and your location is not the US, kindly proceed to the website. Otherwise, you must leave the website in order to comply with government restrictions.

Why does your IP address show your location as the USA?

  • - you are using a VPN provided by a hosting company based in the United States;
  • - your IP does not have proper WHOIS records;
  • - an error occurred in the WHOIS geolocation database.

Please confirm whether you are a US resident or not by clicking the relevant button below. If you choose the wrong option, being a US resident, you will not be able to open an account with InstaForex anyway.

We are sorry for any inconvenience caused by this message.