Analyzing Tuesday's trades:
EUR/USD on 30M chart
EUR/USD traded with a slight downward bias, but I would not interpret this movement as "preparation for the European Central Bank and Federal Reserve meetings". I think that the euro should and will eventually fall, and that it will probably start declining on Wednesday. However, the 50 pips decline on Tuesday and the bounce by the same amount looks more like a flat, not a downtrend. The pair is sliding down, which is a fact, but it might be a part of the three-week flat between 1.0806 and 1.0923. Moreover, the pair did not settle below 1.0806. In general, we should just wait. The outcome of the Fed meeting will be announced on Wednesday evening, after that there might be a burst of market activity. It is possible to say that we already know the results of the meeting, but it is unlikely for the market to ignore this meeting.
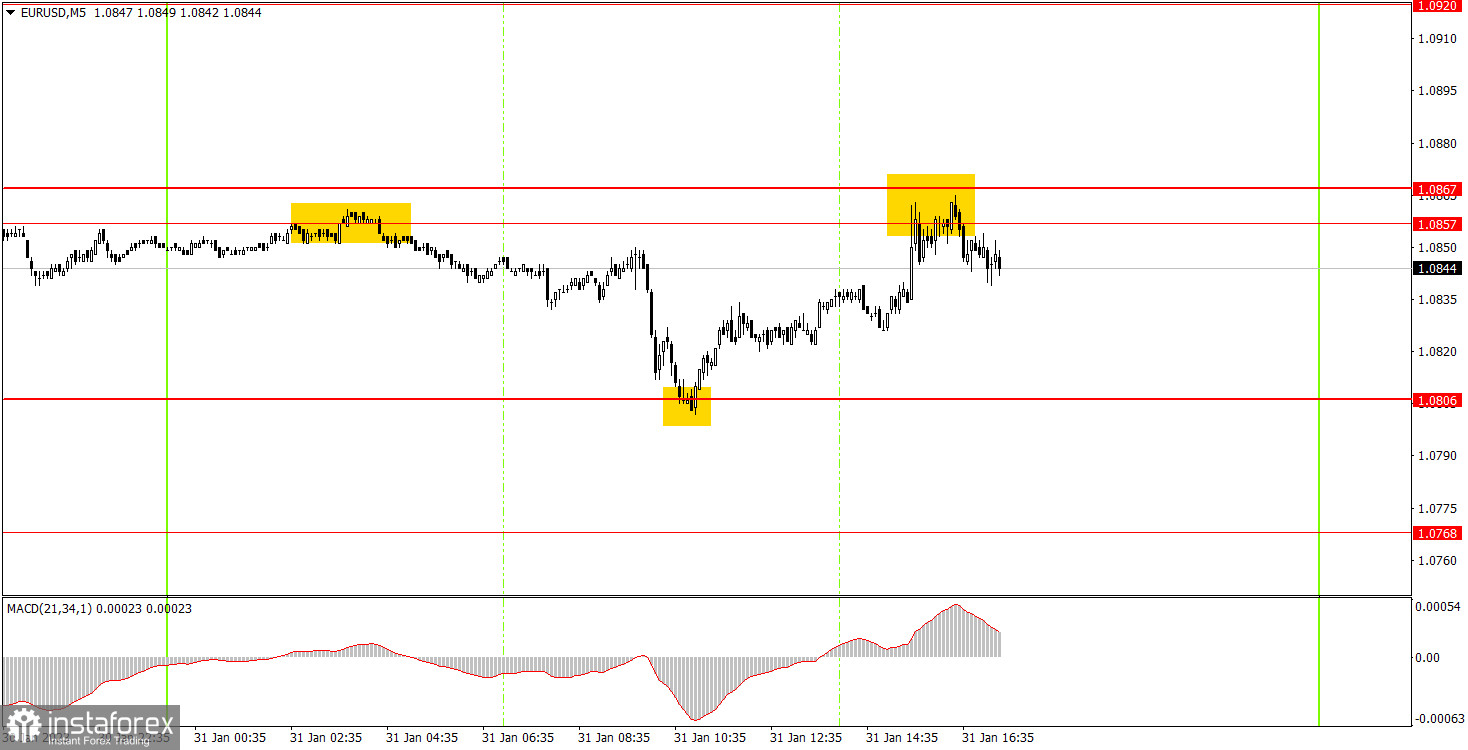
EUR/USD on M5 chart
The 5-minute chart shows the flat even better. The price rebounded from 1.0857, went down to 1.0806 and then returned to 1.0857. The first sell signal was formed last night, and it was up to traders whether they would use it at the opening of the European trading session or not. If beginners used the signal they could gain 30 pips. The buy signal near 1.0806 should have been accepted without any hesitation. The price later rose to 1.0857 and rebounded from this level. Therefore, the profit on the long position was another 30 pips. You could also try the last sell signal, but the pair did not fall further, so most likely you would have incurred a small loss on it (the price did not settle above 1.0867 either), and the deal should have been closed manually.
Trading tips on Wednesday:
On the 30-minute chart, the pair is still trying to form a downtrend and it has crossed the ascending trend line. However, in the next few days there will be so many fundamental and macroeconomic events that the pair could be anywhere by Friday evening. On the 5-minute chart, it is recommended to trade at the levels 1.0657-1.0668, 1.0697, 1.0736, 1.0768, 1.0806, 1.0857-1.0867, 1.0920-1.0923-1.0933, 1.0966, 1.0989. As soon as the price passes 15 pips in the right direction, you should set a Stop Loss to breakeven. On Wednesday, the European Union will publish important reports on inflation for January and unemployment for December. In the US, we can look forward to the results of the Fed meeting in the evening. It could be a very volatile day, but the direction will depend on the nature of the events.
Basic rules of the trading system:
1) The strength of the signal is determined by the time it took the signal to form (a rebound or a breakout of the level). The quicker it is formed, the stronger the signal is.
2) If two or more positions were opened near a certain level based on a false signal (which did not trigger a Take Profit or test the nearest target level), then all subsequent signals at this level should be ignored.
3) When trading flat, a pair can form multiple false signals or not form them at all. In any case, it is better to stop trading at the first sign of a flat movement.
4) Trades should be opened in the period between the start of the European session and the middle of the US trading hours when all positions must be closed manually.
5) You can trade using signals from the MACD indicator on the 30-minute time frame only amid strong volatility and a clear trend that should be confirmed by a trendline or a trend channel.
6) If two levels are located too close to each other (from 5 to 15 pips), they should be considered support and resistance levels.
On the chart:
Support and Resistance levels are the levels that serve as targets when buying or selling the pair. You can place Take Profit near these levels.
Red lines are channels or trend lines that display the current trend and show in which direction it is better to trade now.
The MACD indicator (14, 22, and 3) consists of a histogram and a signal line. When they cross, this is a signal to enter the market. It is recommended to use this indicator in combination with trend patterns (channels and trendlines).
Important announcements and economic reports that can be found on the economic calendar can seriously influence the trajectory of a currency pair. Therefore, at the time of their release, we recommend trading as carefully as possible or exiting the market in order to avoid sharp price fluctuations.
Beginners on Forex should remember that not every single trade has to be profitable. The development of a clear strategy and money management is the key to success in trading over a long period of time.