Analyzing Friday's trades:
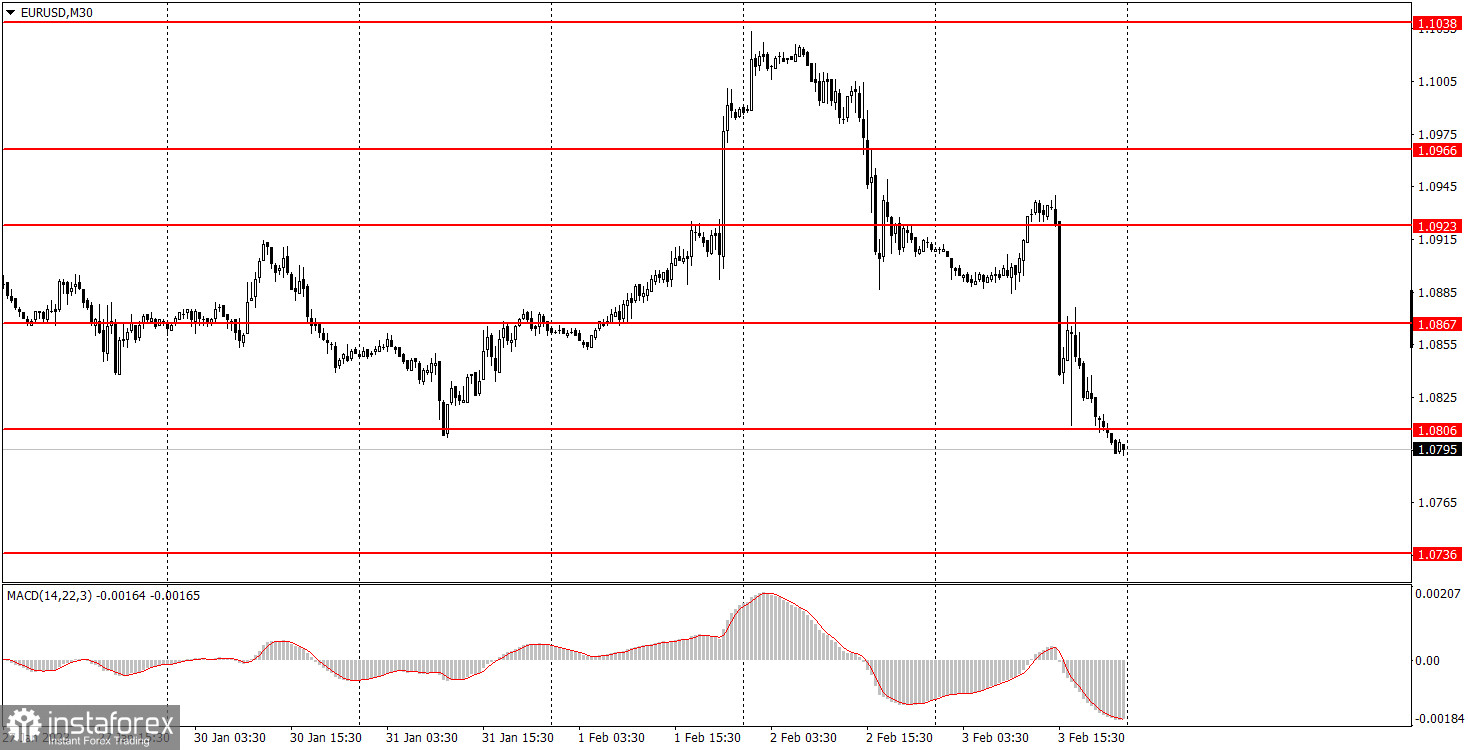
EUR/USD on 30M chart
On Friday, EUR/USD continued to show volatile movements since the macroeconomic background was strong again. To be more precise, not exactly "again", since the fundamental background was strong on Wednesday and Thursday. Anyway, the macro data was not just strong, but in fact, it was very strong, which caused a strong volatility and a good trend movement. The US dollar went up sharply again, which fully meets our expectations. Let me remind you that we have long been waiting for a strong bearish correction, and it looks like it finally started. So, the NonFarm Payrolls report was twice as high as the forecasted value, the ISM Non-Manufacturing Index grew to 55.2 from 49.2, unemployment rate went down to 3.4%. Naturally, with such results, the dollar simply had no right not to rise, which it did. Now I expect quotes to continue to fall in the mid-term as one of the strongest supporting factors of the euro (the divergence between the European Central Bank and Federal Reserve rates) slowly starts to come down.
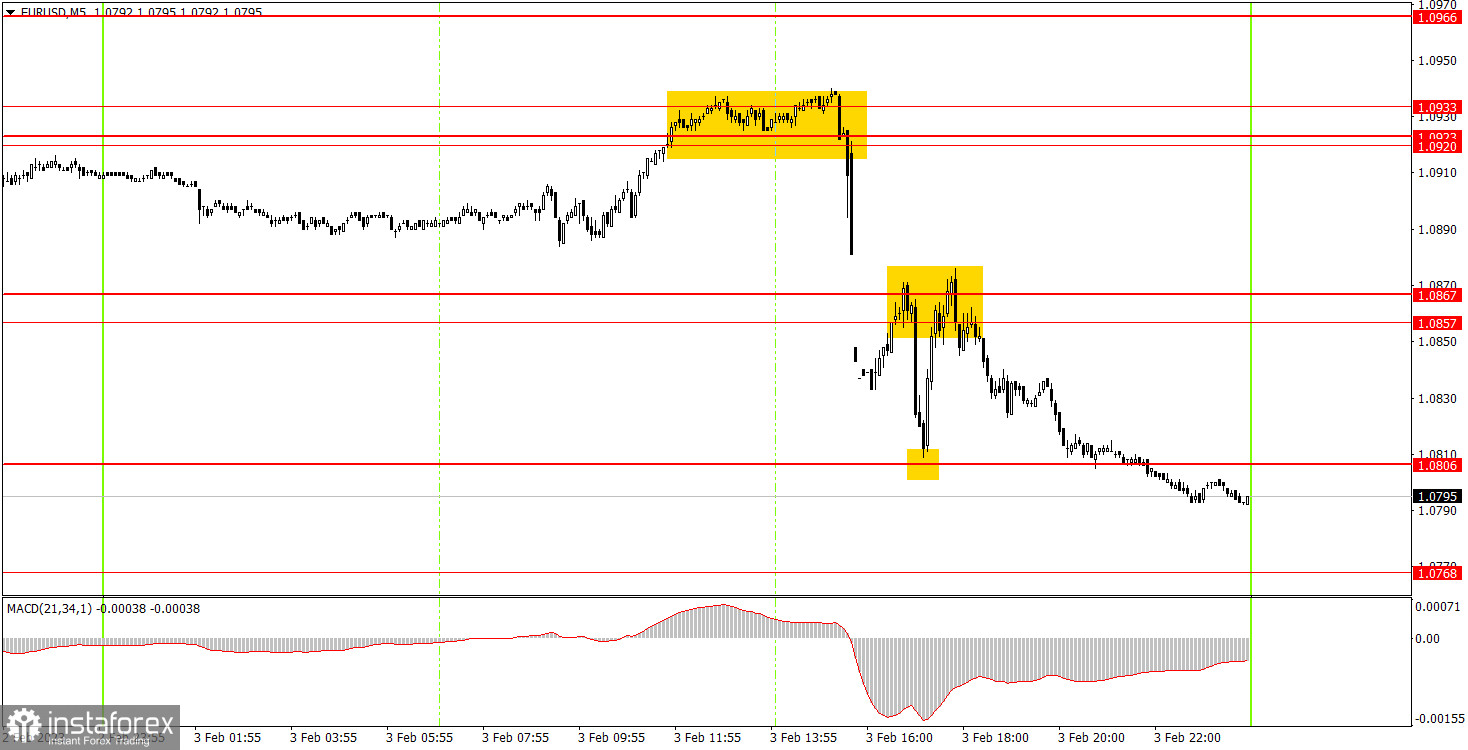
EUR/USD on M5 chart
Despite the fact that the movements were strong on Friday, it was not always easy and simple to work out the trading signals. The first sell signal appeared at the beginning of the US trading session, when the US released all its data. Naturally, the collapse began immediately and it was very problematic to enter the market. However, beginners should not have had any doubts about opening short positions since the US reports were unambiguous. Therefore, if they opened positions they could make a nice profit of about 75 pips since the price fell to 1.0806, from which it bounced. This rebound could also be worked out using a long position, and the price quickly returned to the 1.0857-1.0867 area, where it should have taken a profit - another 10 pips.
Trading tips on Monday:
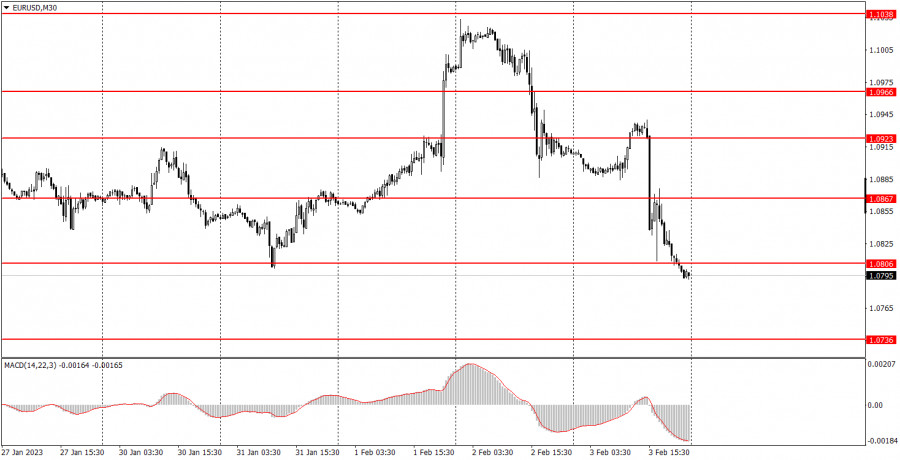
On the 30-minute chart, the pair showed very volatile movement during the second half of this week, which resulted in a significant strengthening of the US currency. The next week should be calmer, and the pair might pull back a little bit to the upside. However, I believe that the euro will continue to fall. On the 5-minute chart, it is recommended to trade at the levels 1.0657-1.0668, 1.0697, 1.0736, 1.0768, 1.0806, 1.0857-1.0867, 1.0920-1.0923-1.0933, 1.0966, 1.0989 and 1.1038. As soon as the price passes 15 pips in the right direction, you should set a Stop Loss to breakeven. On Monday, the European Union will release its retail sales report and ECB President Christine Lagarde will also give a speech. Theoretically, those events may slightly influence the mood of traders, but in practice though, it is very unlikely. Lagarde was speaking just this Thursday; it is unlikely that she will share new information on Monday.
Basic rules of the trading system:
1) The strength of the signal is determined by the time it took the signal to form (a rebound or a breakout of the level). The quicker it is formed, the stronger the signal is.
2) If two or more positions were opened near a certain level based on a false signal (which did not trigger a Take Profit or test the nearest target level), then all subsequent signals at this level should be ignored.
3) When trading flat, a pair can form multiple false signals or not form them at all. In any case, it is better to stop trading at the first sign of a flat movement.
4) Trades should be opened in the period between the start of the European session and the middle of the US trading hours when all positions must be closed manually.
5) You can trade using signals from the MACD indicator on the 30-minute time frame only amid strong volatility and a clear trend that should be confirmed by a trendline or a trend channel.
6) If two levels are located too close to each other (from 5 to 15 pips), they should be considered support and resistance levels.
On the chart:
Support and Resistance levels are the levels that serve as targets when buying or selling the pair. You can place Take Profit near these levels.
Red lines are channels or trend lines that display the current trend and show in which direction it is better to trade now.
The MACD indicator (14, 22, and 3) consists of a histogram and a signal line. When they cross, this is a signal to enter the market. It is recommended to use this indicator in combination with trend patterns (channels and trendlines).
Important announcements and economic reports that can be found on the economic calendar can seriously influence the trajectory of a currency pair. Therefore, at the time of their release, we recommend trading as carefully as possible or exiting the market in order to avoid sharp price fluctuations.
Beginners on Forex should remember that not every single trade has to be profitable. The development of a clear strategy and money management is the key to success in trading over a long period of time.