Analyzing Friday's trades:
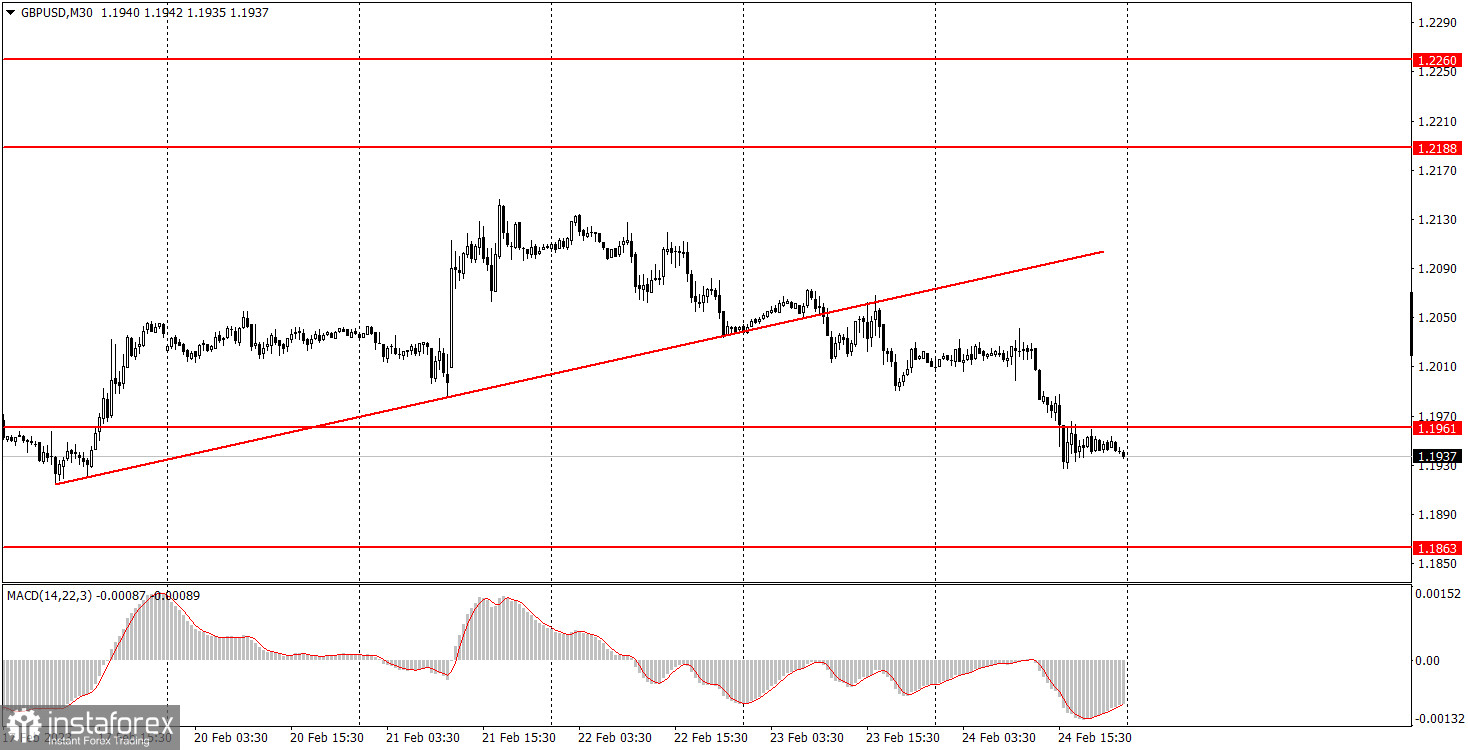
GBP/USD on 30M chart
GBP/USD also continued its downward movement on Friday after breaking the ascending trend line. Thus, both technical signals and the fundamental background spoke in favor of the dollar's growth. The British pound traded a little differently from the euro. On Tuesday, the pound received significant support from the UK PMI data, due to which it rose considerably. However, the British currency should keep on falling in the mid-term, since the market has already worked out all bases for its purchases. In fact, the pound also rose by leaps and bounds in recent months, even if there weren't any good reasons and grounds for it. Now it's time to "pay back the debts," and the pound has not yet fully paid them. As for the fundamental and macroeconomic background on Friday, there was absolutely nothing interesting in Britain. On the other hand, some minor reports from the US could've helped the dollar grow. In fact, it did rise during the day and it didn't need any help from these reports.
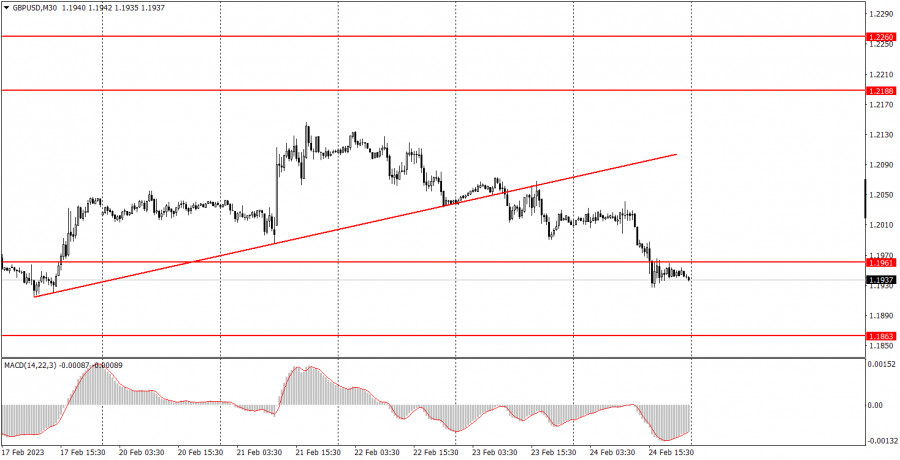
GBP/USD on 5M chart
On the 5-minute chart, we could see that Friday's main movement happened at the end of the European session and the beginning of the US one. It was the time when there was no important data and events. Unfortunately, it was impossible to catch the beginning of this movement, and the first signal appeared when the market should have been closed. Anyway, even if beginners wanted to use the signal to overcome the area of 1.1950-1.1961, they should not do it, because the pound had already fallen by about 100 points. But even if they opened a position, there would be no loss because the pair was moving along the marked area below it till the end.
Trading tips on Monday:
On the 30-minute chart, GBP/USD continues a sluggish downward movement, which is in line with our expectations. Bears continue to "rule the ball", but the pressure they exert on the pair is not that strong. There is no important news and almost no reports, so it is not surprising that there are days when the movements are very strange and difficult to determine. On the 5-minute chart, it is recommended to trade at the levels 1.1716, 1.1793, 1.1863-1.1877, 1.1950-1.1957-1.1961, 1.2065-1.2079, 1.2138, 1.2171-1.2179. As soon as the price passes 20 pips in the right direction, you should set a Stop Loss to breakeven. There are no important events scheduled for Monday in the UK. In America, there's just one report on orders for durable goods. Given the status of Monday, the movements may be weak and flat.
Basic rules of the trading system:
1) The strength of the signal is determined by the time it took the signal to form (a rebound or a breakout of the level). The quicker it is formed, the stronger the signal is.
2) If two or more positions were opened near a certain level based on a false signal (which did not trigger a Take Profit or test the nearest target level), then all subsequent signals at this level should be ignored.
3) When trading flat, a pair can form multiple false signals or not form them at all. In any case, it is better to stop trading at the first sign of a flat movement.
4) Trades should be opened in the period between the start of the European session and the middle of the US trading hours when all positions must be closed manually.
5) You can trade using signals from the MACD indicator on the 30-minute time frame only amid strong volatility and a clear trend that should be confirmed by a trendline or a trend channel.
6) If two levels are located too close to each other (from 5 to 15 pips), they should be considered support and resistance levels.
On the chart:
Support and Resistance levels are the levels that serve as targets when buying or selling the pair. You can place Take Profit near these levels.
Red lines are channels or trend lines that display the current trend and show in which direction it is better to trade now.
The MACD indicator (14, 22, and 3) consists of a histogram and a signal line. When they cross, this is a signal to enter the market. It is recommended to use this indicator in combination with trend patterns (channels and trendlines).
Important announcements and economic reports that can be found on the economic calendar can seriously influence the trajectory of a currency pair. Therefore, at the time of their release, we recommend trading as carefully as possible or exiting the market in order to avoid sharp price fluctuations.
Beginners on Forex should remember that not every single trade has to be profitable. The development of a clear strategy and money management is the key to success in trading over a long period of time.