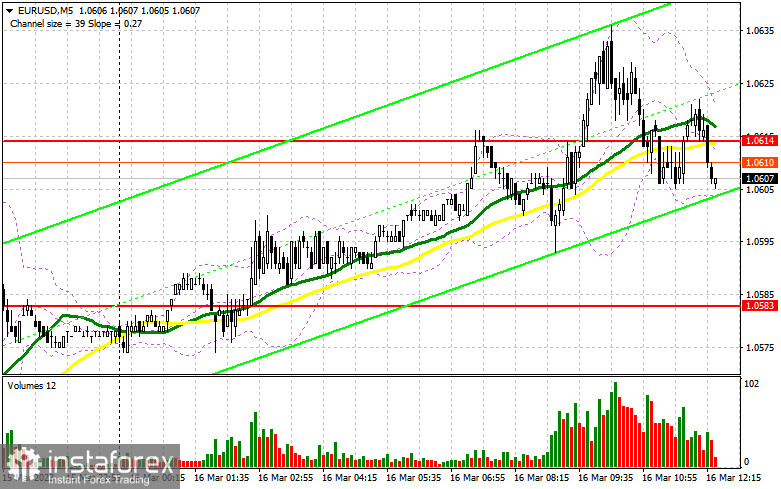
In my morning article, I turned your attention to 1.0614 and recommended making decisions with this level in focus. Now, let's look at the 5-minute chart and figure out what actually happened. A breakout of this level occurred without a downward retest. So, there were no entry points from this level. For the afternoon, the technical outlook was revised.
When to open long positions on EUR/USD:
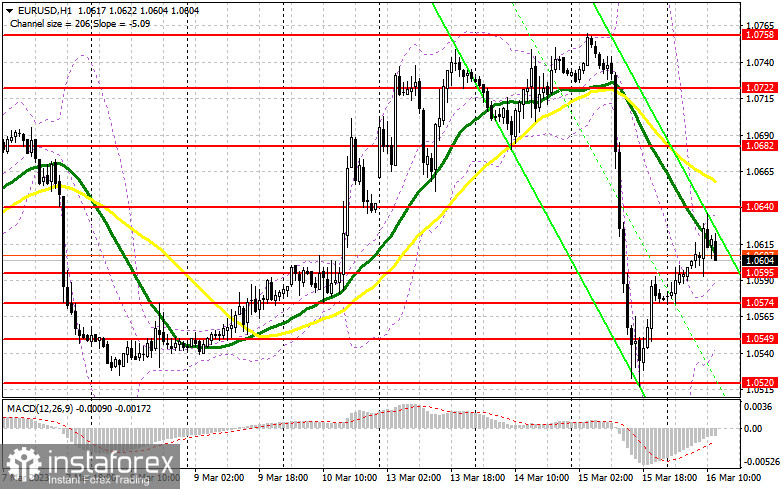
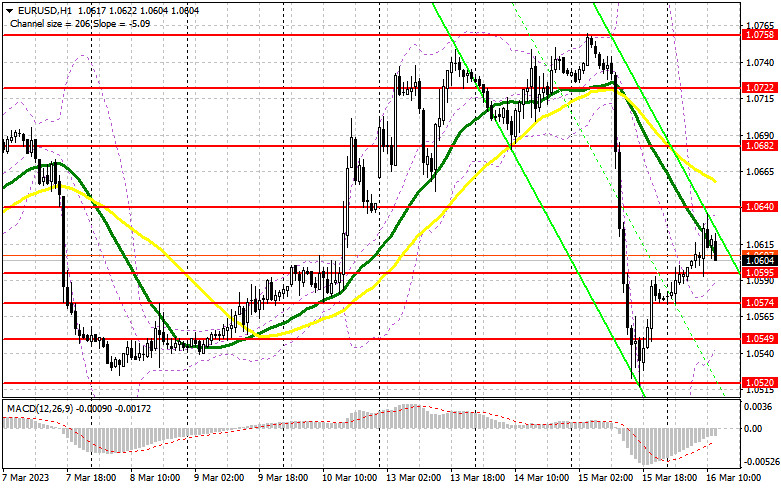
Traders are now anticipating the ECB's key rate decision. If the regulator raises the interest rate by 25 basis points or decides not to hike it at all, the pressure on the euro will increase. The euro/dollar pair is sure to drop. Strong economic data on US initial jobless claims, building permits, and housing starts will boost the US dollar. In this case, only a false breakout of 1.0595 will give a buy signal and indicate the presence of bulls in the market despite the likelihood of an aggressive rate hike by the ECB. The target is the resistance level of 1.0640, formed yesterday. A breakout and a downward retest of this level could push the pair to 1.0682. Below this level, the moving averages are passing. It may trigger a larger upward movement to 1.0722. A more distant target level is located at a high of 1.0758. The pair is likely to rise to this level if the ECB maintains aggressive tightening and raises the rate by 50 basis points. At this level, I recommend locking in profits. If EUR/USD declines and buyers show no activity at 1.0595 in the afternoon, which is very likely, the pressure on the euro will return. In this case, only a false breakout of the support level of 1.0574 will provide new entry points into long positions. You could buy EUR/USD after a bounce from 1.0549 or 1.0520, keeping in mind an upward intraday correction of 30-35 pips.
When to short positions on EUR/USD:
The sellers need now to take control of the support level of 1.0595, formed in the morning. At the same time, they need to defend the resistance level of 1.0640. The price could move to it immediately after the ECB's decision as well as weak US data, indicating an increase in the unemployment rate. A false breakout of 1.0640 will give a sell signal, which could lead to a decrease to 1.0595. A breakout and an upward retest of this level will create new entry points into short positions. It will force bulls to close their Stop Loss orders, which will push the pair down to 1.0574. After a decline below this level, the pair may dip to the support level of 1.0549 where I recommend locking in profits. At this level, large buyers may return to the market, betting on a further recovery of the euro by the end of March after the Fed meeting. If EUR/USD rises during the US session and bears show no energy at 1.0640, the bulls will retain control of the market. In this case, I would advise you to postpone sales until a false breakout of 1.0682. You could sell EUR/USD at a bounce from 1.0722 or 1.0758, keeping in mind a downward intraday correction of 30-35 pips.
COT report
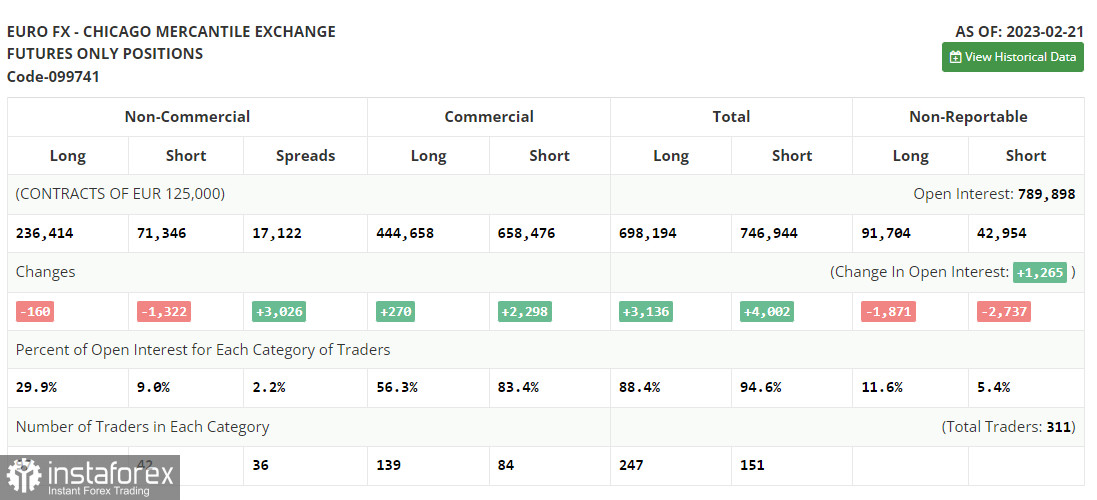
The COT report for February 21 logged a decrease in both long and short positions. In fact, the COT data from a month ago is of little interest at this point as it is not relevant due to the technical glitch the CFTC recently suffered. This week, traders are looking forward to the inflation data in the US which may support the view about the Fed's possible abandonment of aggressive monetary policy. The SVB meltdown and risks of a collapse in the US banking sector will surely change the Fed's stance on rate hikes. According to the COT report, long non-commercial positions decreased by 160 to 236,414. Short non-commercial positions dropped by 1,322 to 71,346. The non-commercial net position came in at 165,038 versus 150,509. The weekly closing price fell to 1.0698 from 1.0742.
Indicators' signals:
Trading is carried out below the 30 and 50 daily moving averages, which indicates the likelihood of a downward movement in the short term.
Moving averages
Note: The period and prices of moving averages are considered by the author on the H1 (1-hour) chart and differ from the general definition of the classic daily moving averages on the daily D1 chart.
Bollinger Bands
If EUR/USD rises, the indicator's upper border at 1.0635 will serve as resistance.
Description of indicators
- Moving average (moving average, determines the current trend by smoothing out volatility and noise). Period 50. It is marked yellow on the chart.
- Moving average (moving average, determines the current trend by smoothing out volatility and noise). Period 30. It is marked green on the chart.
- MACD indicator (Moving Average Convergence/Divergence - convergence/divergence of moving averages) Quick EMA period 12. Slow EMA period to 26. SMA period 9
- Bollinger Bands (Bollinger Bands). Period 20
- Non-commercial speculative traders, such as individual traders, hedge funds, and large institutions that use the futures market for speculative purposes and meet certain requirements.
- Long non-commercial positions represent the total long open position of non-commercial traders.
- Short non-commercial positions represent the total short open position of non-commercial traders.
- Total non-commercial net position is the difference between the short and long positions of non-commercial traders.