Analyzing Tuesday's trades:
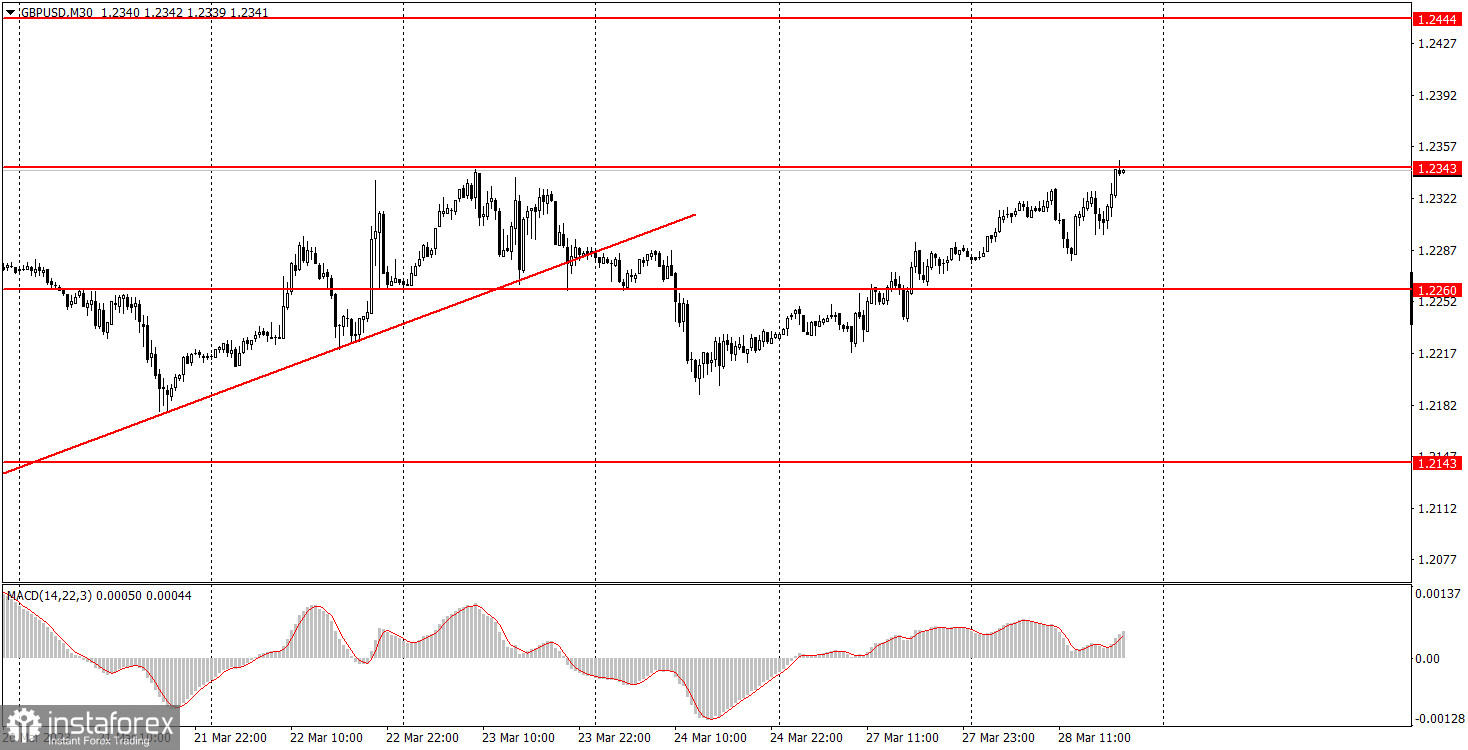
GBP/USD on 30M chart
On Tuesday, GBP/USD continued to trade higher and has already reached its last local high. It may seem that the previous movements were quite strong since the pair reached the last peak, but in fact it wasn't. The volatility of the pair was about 70 pips on Tuesday and 75 on Monday. This is very little for the pound. Therefore, we have a case of systematic growth, which is very difficult to justify from a fundamental perspective. Bank of England Governor Andrew Bailey gave speeches on Monday and Tuesday, and take note that he rarely gives speeches. And even more rarely does he make resonant statements. This time it was exactly the same. Bailey hinted that the BoE rate will continue to rise, but it is unlikely to reach the 2008 peak. However, traders expected that the rate will grow for some time and will not grow to such a value that inflation will return to 2%. Therefore, Bailey did not really say anything new. Though the price has consolidated below the trend line, we see that it has no effect on market sentiment. There is a hope for a rebound from 1.2343, which will make it possible to form a "double-top" pattern, but there are not many chances.
GBP/USD on 5M chart
No trading signals on Tuesday. The 5-minute chart shows that the pair's movement was close to a flat, which is always fraught with false signals and losses. So it's very good that the first and only signal was formed closer to evening and beginners shouldn't have used that.
Trading tips on Wednesday:
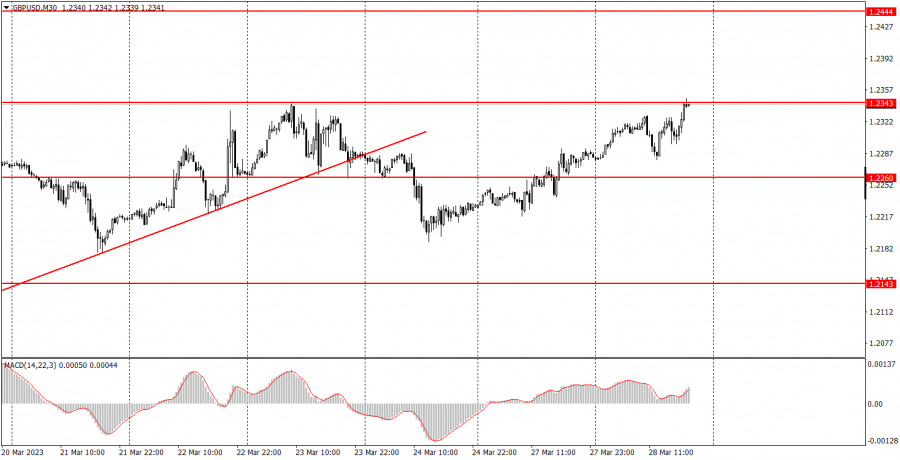
On the 30-minute chart, GBP/USD continues to trade in the classic "swing", but in the long term. After several weeks of growth, we have long been waiting for the pair to enter a bearish correction. But this correction might already end, and so far it seems that the market only wants to buy. A new round of decline may start from 1.2343, but overcoming this level will restore the uptrend. On the 5-minute chart, it is recommended to trade at the levels 1.1924, 1.1992-1.2008, 1.2065-1.2079, 1.2143, 1.2171-1.2179, 1.2245-1.2260, 1.2337-1.2343, 1.2387, 1.2444-1.2471. As soon as the price passes 20 pips in the right direction, you should set a Stop Loss to breakeven. There are no important events or reports planned in the UK and the US. However, it was the same thing during the first two days of the week, and traders still managed to return the pair to local highs. The volatility is weak and it is likely to remain so on Wednesday.
Basic rules of the trading system:
1) The strength of the signal is determined by the time it took the signal to form (a rebound or a breakout of the level). The quicker it is formed, the stronger the signal is.
2) If two or more positions were opened near a certain level based on a false signal (which did not trigger a Take Profit or test the nearest target level), then all subsequent signals at this level should be ignored.
3) When trading flat, a pair can form multiple false signals or not form them at all. In any case, it is better to stop trading at the first sign of a flat movement.
4) Trades should be opened in the period between the start of the European session and the middle of the US trading hours when all positions must be closed manually.
5) You can trade using signals from the MACD indicator on the 30-minute time frame only amid strong volatility and a clear trend that should be confirmed by a trendline or a trend channel.
6) If two levels are located too close to each other (from 5 to 15 pips), they should be considered support and resistance levels.
On the chart:
Support and Resistance levels are the levels that serve as targets when buying or selling the pair. You can place Take Profit near these levels.
Red lines are channels or trend lines that display the current trend and show in which direction it is better to trade now.
The MACD indicator (14, 22, and 3) consists of a histogram and a signal line. When they cross, this is a signal to enter the market. It is recommended to use this indicator in combination with trend patterns (channels and trendlines).
Important announcements and economic reports that can be found on the economic calendar can seriously influence the trajectory of a currency pair. Therefore, at the time of their release, we recommend trading as carefully as possible or exiting the market in order to avoid sharp price fluctuations.
Beginners on Forex should remember that not every single trade has to be profitable. The development of a clear strategy and money management is the key to success in trading over a long period of time.