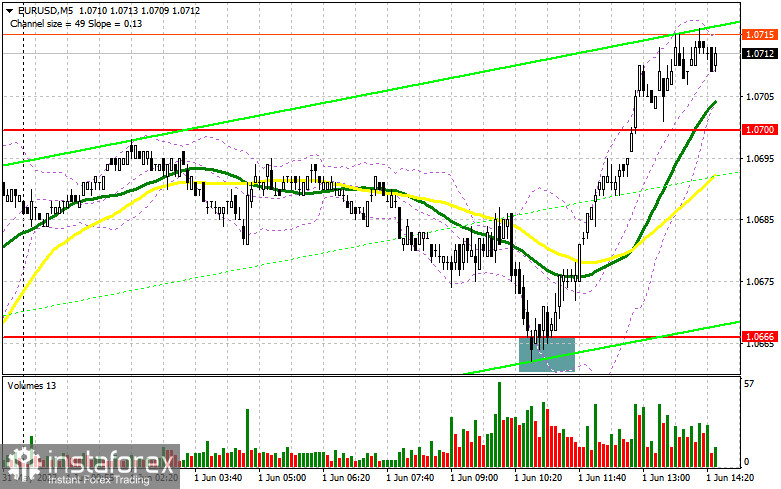
In my morning forecast, I drew attention to the level of 1.0666 and recommended making entry decisions based on it. Let's look at the 5-minute chart and analyze what happened there. The decline and the formation of a false breakout led to an excellent entry point for buying, increasing the euro by more than 40 points. The technical picture stayed the same for the second half of the day.
To open long positions on EUR/USD, the following conditions are required:
We expect a decrease in inflationary pressure and the maintenance of production activity in the Eurozone at a low level, which is expected to put pressure on the euro in the first half of the day. However, buyers took advantage of this moment and performed well, around 1.0666. In the second half of the day, speeches by members of the FOMC are planned, including Patrick T. Harker, who spoke extensively yesterday about the need for a pause in the actions of the Federal Reserve. We also expect figures on the ISM Manufacturing Index, a decrease that will exert further pressure on the dollar, and less active growth in ADP employment figures. Weekly figures on initial jobless claims will be of little interest.
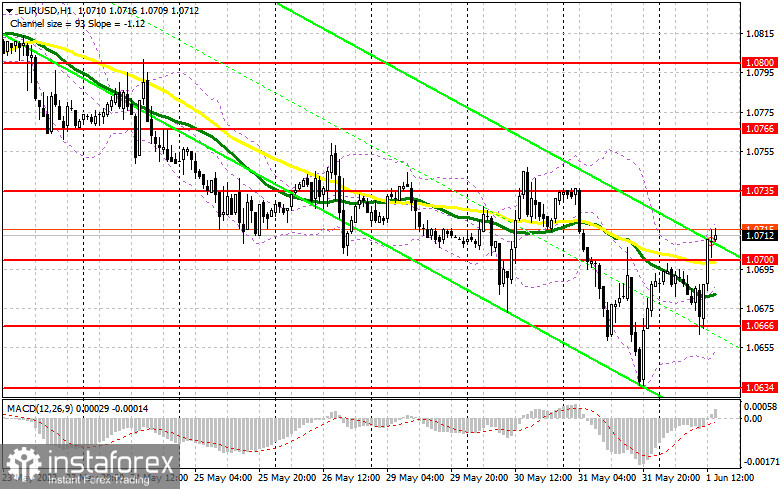
For this reason, I will act only on the decline after forming a false breakout around the new intermediate support level of 1.0700, which was resistance in the morning. This will confirm the presence of buyers pushing the euro up against the bearish trend and provide an opportunity to enter long positions with the growth target towards the next resistance at 1.0735. A breakthrough and a top-down test of this range in the second half of the day will strengthen demand for the euro, creating an additional entry point for increasing long positions with a maximum update of around 1.0766. The ultimate target remains the area of 1.0800, where I will take profit. In the case of a decline in EUR/USD and the absence of buyers at 1.0700, which cannot be ruled out with good figures on the US labor market, a return to the bearish trend can be expected. Therefore, only the formation of a false breakout around the minimum of 1.0666, similar to what I discussed earlier, will signal to buy off the euro. I will open long positions immediately on the rebound from 1.0634 with the target of an upward correction of 30-35 points within the day.
To open short positions on EUR/USD, the following conditions are required:
Bears are retreating, especially after representatives of the Federal Reserve refuted talks related to further interest rate hikes. Protecting the nearest resistance at 1.0735 is now a priority and a suitable scenario for increasing short positions. A false breakout at this level will signal to sell and could push the pair toward 1.0700. Consolidation below this range and a reverse test from below to above will lead straight to 1.0666, where the euro was already bought excellently today. The ultimate target will be the area of 1.0634, where I will take profit. In the event of an upward movement of EUR/USD during the US session and the absence of bears at 1.0735, a continuation of the upward correction of the pair can be expected. In this case, I will postpone short positions until 1.0766. Selling is also possible there, but only after an unsuccessful consolidation. I will open short positions immediately on the rebound from the maximum of 1.0800 with the target of a downward correction of 30-35 points.
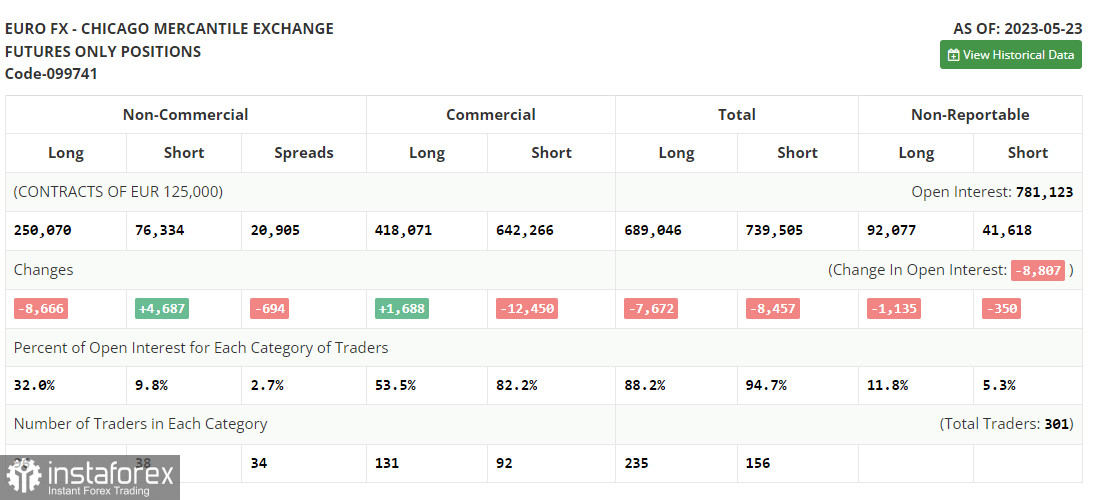
In the COT (Commitment of Traders) report for May 23rd, there was a reduction in long positions and an increase in short positions. The decline in the euro continued as the situation with government debt had not yet been resolved, and the risks of a more severe recession in the US remained. But even after the news of reaching an agreement and avoiding a US default, the dollar remained in demand. The latest inflation data confirmed the need for further rate hikes by the Federal Reserve, so investors no longer expect calm during the summer period. The COT report indicates that non-commercial long positions decreased by 8,666 to 250,070, while non-commercial short positions increased by 4,687 to 76,334. At the end of the week, the overall non-commercial net position increased to 185,045 from 187,089. The weekly closing price decreased to 1.0793 from 1.0889.
Indicator signals:
Moving averages.
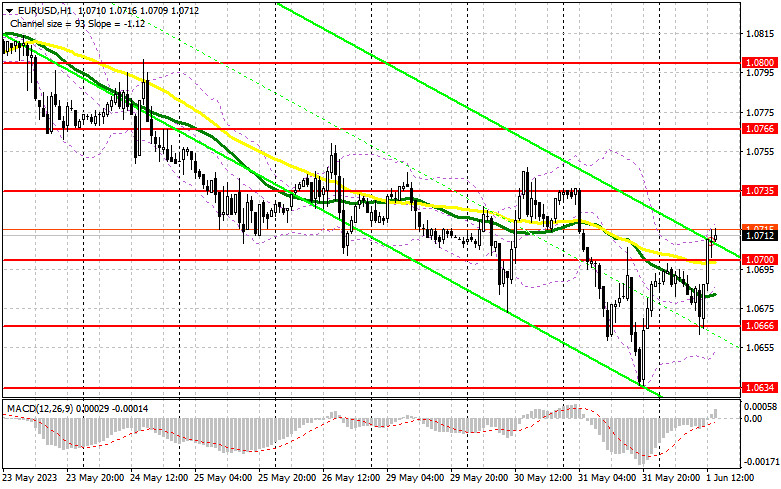
Trading is conducted above the 30-day and 50-day moving averages, indicating the likelihood of an upward correction.
Note: The author considers the period and prices of the moving averages on the hourly chart (H1), which differs from the general definition of classic daily moving averages on the daily chart (D1).
Bollinger Bands
In case of an increase, the upper boundary of the indicator around 1.0715 will act as resistance.
Description of indicators:
• Moving average (determines the current trend by smoothing volatility and noise). Period 50. Marked in yellow on the chart.
• Moving average (determines the current trend by smoothing volatility and noise). Period 30. Marked in green on the chart.
• MACD indicator (Moving Average Convergence/Divergence). Fast EMA period 12. Slow EMA period 26. SMA period 9.
• Bollinger Bands. Period 20.
• Non-commercial traders - speculators such as individual traders, hedge funds, and large institutions using the futures market for speculative purposes and meeting specific requirements.
• Long non-commercial positions represent the total long open positions of non-commercial traders.
• Short non-commercial positions represent the total short open positions of non-commercial traders.
• The net non-commercial position is the difference between non-commercial traders' short and long positions.