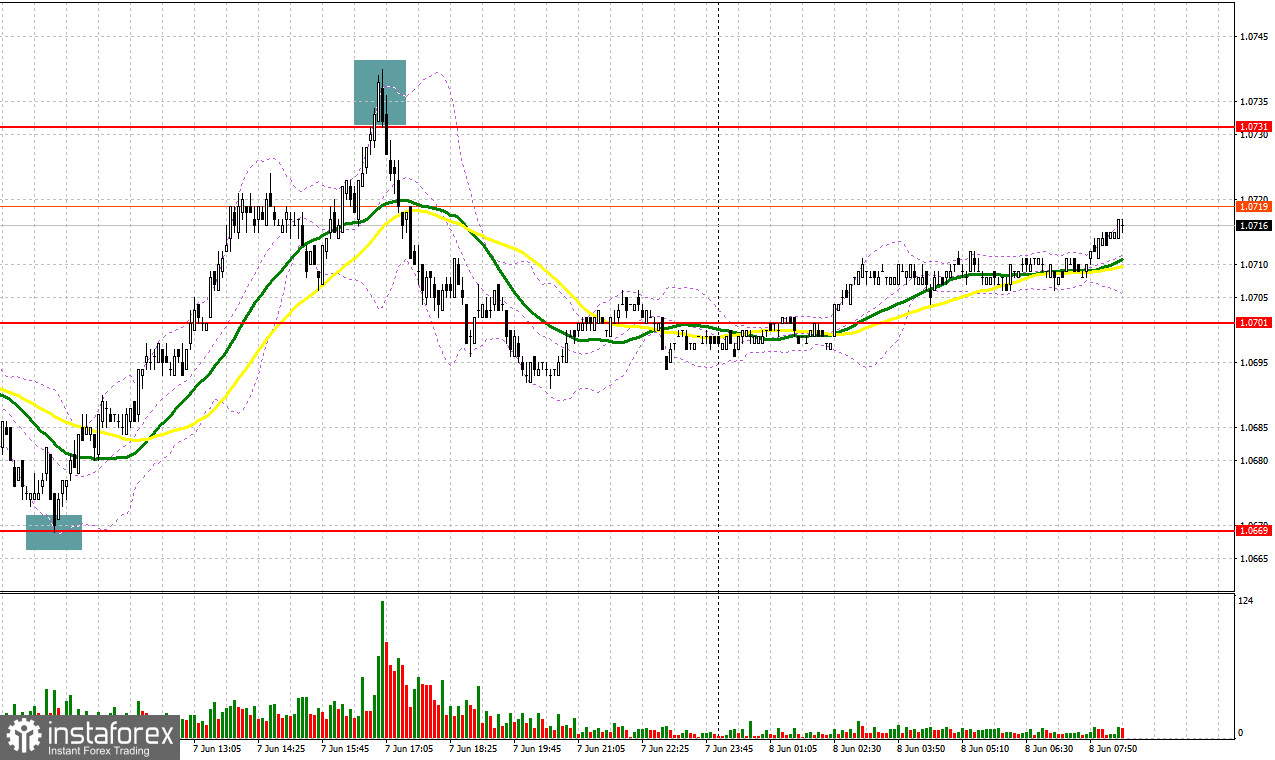
Yesterday, there were some signals to enter the market. Let's look at the 5-minute chart and figure out what happened. Previously, I considered entering the market from 1.0669. A decline and false breakout of this mark produced a buy signal, resulting in a pair's growth of over 50 pips. In the second half of the day, actively protecting 1.0731 provided a sell signal, and you could take about 30 pips more profit from the market.
For long positions on EUR/USD:
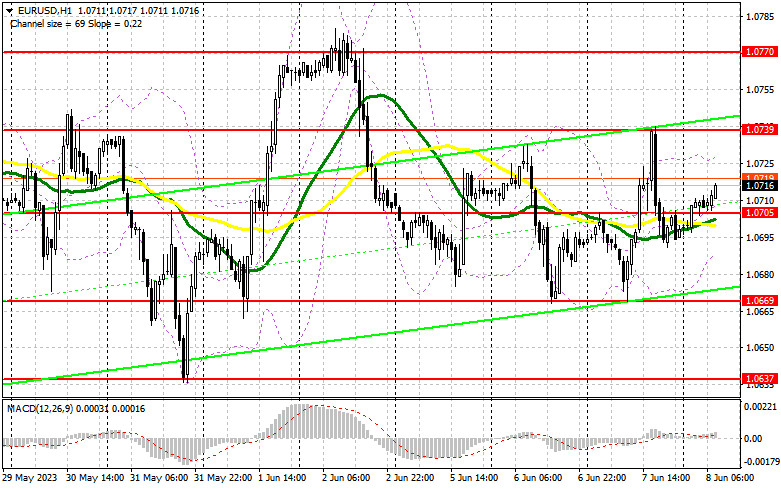
The only thing to watch out for this morning is the euro area GDP report. A revised eurozone GDP report for Q4 2022 is expected as well as Q1 2023. It is projected that the data will be revised downwards, which may put some pressure on the euro, preventing buyers from rising further. For this reason, I will act within the sideways channel on a decline from 1.0705, which is in line with the bullish moving averages.
A false breakout of this level will produce a buy signal, making it possible for the pair to return to 1.0739, where sellers were active yesterday. A breakout and a downward test of this level will boost the demand for the euro, making it possible to break out of the sideways channel, providing an additional entry point into long positions. The pair may reach 1.0770. A more distant target will be 1.0800 where I recommend locking in profits. In the event of a decline and bulls fail to defend 1.0705, which is more likely in the first half of the day, the pressure on the pair may return. Therefore, only a false breakout at the lower limit of the sideways channel at 1.0669 will give new entry points into long positions. You could buy EUR/USD at a bounce from the low of 1.0637, keeping in mind an upward intraday correction of 30-35 pips.
For short positions on EUR/USD:
The bears performed well yesterday afternoon and today we can count on another weak eurozone data, indicating that the region is slowly but surely sliding into a technical recession. But I do not plan to rush in selling today: protecting the resistance level at 1.0739, similar to yesterday, will be a good scenario for increasing short positions. A false breakout at 1.0739 will form a sell signal that could push the pair to 1.0705, the middle of the sideways channel. Consolidation below this level, as well as an upwards reverse test will trigger a decline to 1.0669. A more distant target will be the 1.0637 low where I recommend locking in profits. If EUR/USD rises during the European session and bears fail to protect 1.0739, the bulls will try to regain control, which will increase chances of making a new trend. In such a case, only a false breakout in the area of the next resistance at 1.0770 will form an entry point for short positions. You could sell EUR/USD at a bounce from the 1.0800 high, keeping in mind a downward intraday correction of 30-35 pips.
COT report:
According to the COT report (Commitment of Traders) for May 30, there was a decline in long and short positions. However, a drop in long positions was bigger. It indicates falling demand for risk assets. Traders are unwilling to buy the euro due to fears of a slowdown in the European economy and a recession. What is more, the ECB sticks to aggressive monetary tightening even despite the first signs of a steady decline in inflation. Therefore, they prefer a wait-and-see approach. Meanwhile, the US labor remains resilient. Even if the Fed takes a pause in June, it is likely to keep raising rates, boosting demand for the US dollar. The COT report showed that long non-commercial positions decreased by 8,253 to 241,817, while short non-commercial positions fell by 242 to 76,092. At the end of the week, the total non-commercial net position amounted to 163,054 against 185,045. The weekly closing price slipped to 1.0732 against 1.0793.
Indicator signals:
Moving Averages
Trading is carried out above the 30 and 50-day moving averages, which indicates that the bulls are trying to get back into the market.
Please note that the time period and levels of the moving averages are analyzed only for the H1 chart, which differs from the general definition of the classic daily moving averages on the D1 chart.
Bollinger Bands
If the pair falls, the lower band of the indicator at 1.0690 will act as support.
Description of indicators:
• A moving average of a 50-day period determines the current trend by smoothing volatility and noise; marked in yellow on the chart;
• A moving average of a 30-day period determines the current trend by smoothing volatility and noise; marked in green on the chart;
• MACD Indicator (Moving Average Convergence/Divergence) Fast EMA with a 12-day period; Slow EMA with a 26-day period. SMA with a 9-day period;
• Bollinger Bands: 20-day period;
• Non-commercial traders are speculators such as individual traders, hedge funds, and large institutions who use the futures market for speculative purposes and meet certain requirements;
• Long non-commercial positions represent the total number of long positions opened by non-commercial traders;
• Short non-commercial positions represent the total number of short positions opened by non-commercial traders;
• The non-commercial net position is the difference between short and long positions of non-commercial traders.