Analysis of Thursday's Trades:
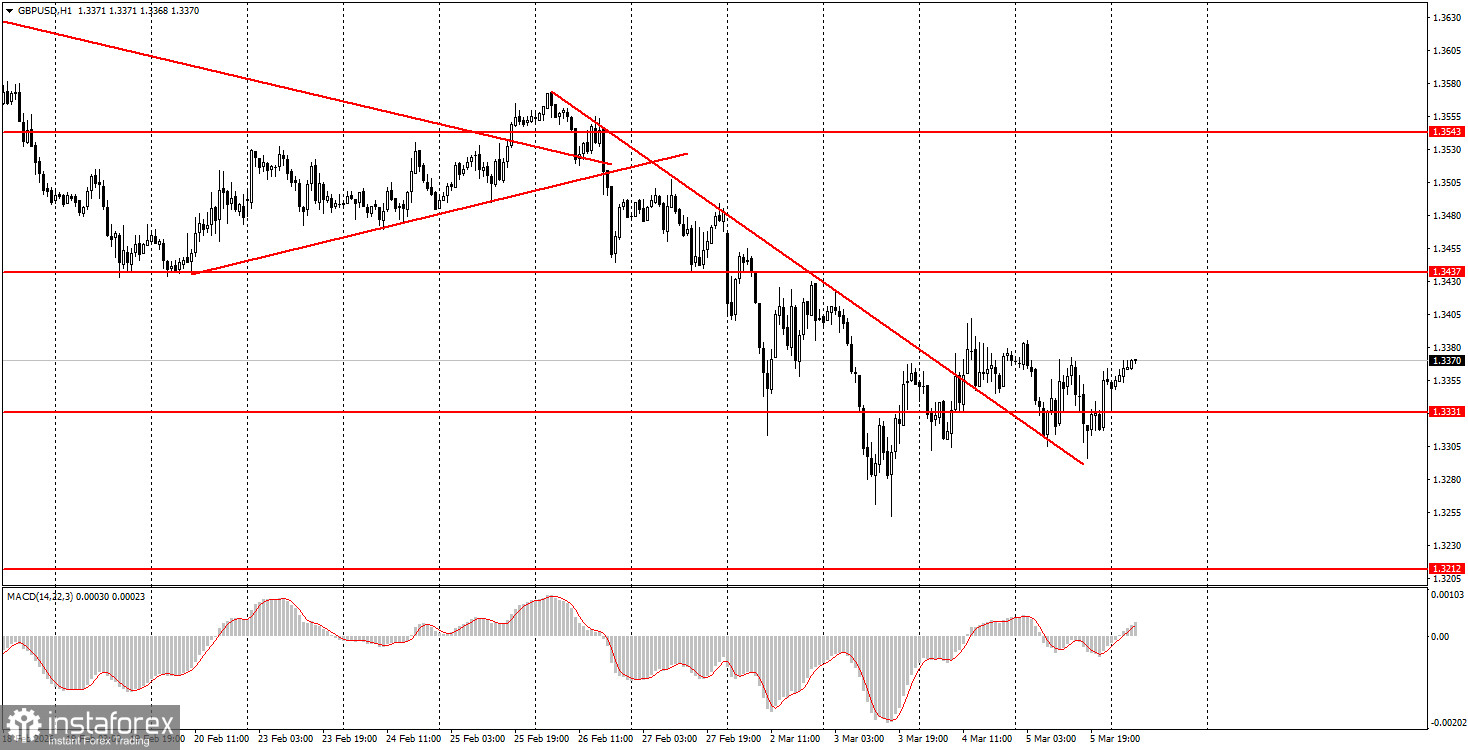
1H Chart of the GBP/USD Pair
On Thursday, the GBP/USD pair traded very chaotically. The day before, a descending trend line was breached, suggesting an upward trend. However, we have seen such situations at least three times in the past month and a half. In none of these instances did the British pound demonstrate a substantial upward trend. Today, the NonFarm Payrolls reports and the unemployment rate in the US could very well provoke a new decline. Additionally, the intensification of the escalation in the Middle East might trigger a new rise in the US dollar, given its status as a safe-haven asset. Thus, technically, the pound could and should start rising. However, macroeconomically and fundamentally, the chances for this are currently low. On Friday, traders will make decisions based on macroeconomic data from across the ocean. There were no significant events in the UK yesterday, and the only American report could not influence the pair's movement throughout the day.
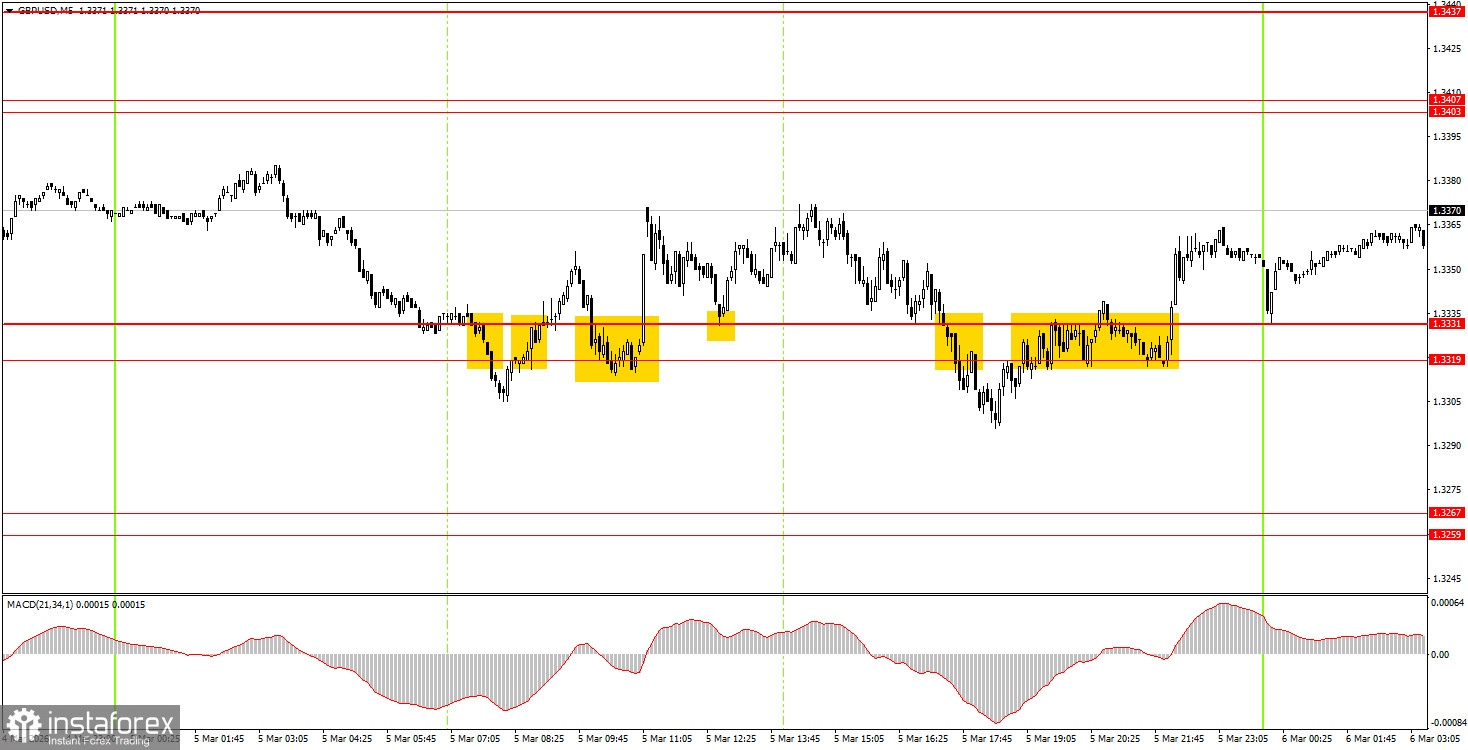
5M Chart of the GBP/USD Pair
On the 5-minute timeframe, several trading signals were formed on Thursday, but the movement throughout the day was sideways. The situation was similar to that of the euro currency. There were many signals, but all were somewhat false due to the nature of the movements. Thus, beginner traders could have acted on the first two signals, after which the best decision would have been to conclude trading for the day.
How to Trade on Friday:
On the hourly timeframe, the GBP/USD pair continues to form a "geopolitical trend." There are no global foundations for medium-term dollar growth, which is why we expect the global upward trend from 2025 to continue in 2026, potentially bringing the pair to at least the 1.4000 mark. In recent weeks, the situation has often not favored the British currency, and the market is completely focused on the war in the Middle East, which is driving the US currency higher.
On Friday, beginner traders may consider opening long positions if there is a bounce from the 1.3319-1.3331 area, targeting 1.3403-1.3407. A consolidation below the 1.3319-1.3331 area will allow opening new short positions targeting 1.3259-1.3267.
On the 5-minute timeframe, trading can currently be conducted at levels of 1.3203-1.3212, 1.3259-1.3267, 1.3319-1.3331, 1.3403-1.3407, 1.3437-1.3446, 1.3484-1.3489, 1.3529-1.3543, 1.3643-1.3652, 1.3695, 1.3741-1.3751. On Friday, no significant events are scheduled in the UK, while the US will release important labor market and unemployment data, along with several secondary reports. Therefore, substantial movements can be expected in the second half of the day.
Key Principles of the Trading System:
- The strength of a signal is determined by the time it takes to form the signal (bounce or breakout). The less time taken, the stronger the signal.
- If two or more trades have been opened at a particular level based on false signals, all subsequent signals from that level should be ignored.
- In a flat market, any pair can form many false signals or none at all. In any case, at the first signs of a flat trend, it is best to stop trading.
- Trading deals are to be opened during the period between the start of the European session and the mid-American session, after which all trades should be closed manually.
- On the hourly timeframe, it is preferable to trade based on signals from the MACD indicator only when there is good volatility and a trend confirmed by a trend line or trend channel.
- If two levels are positioned too close together (5-20 pips apart), they should be considered a support or resistance area.
- Upon moving 20 pips in the correct direction, a Stop Loss should be set to breakeven.
What to Look for on the Charts:
Price levels of support and resistance are levels that serve as targets when opening buys or sells. Take Profit levels can be placed around them.
Red lines represent channels or trend lines that show the current trend and indicate the direction in which it is preferable to trade now.
The MACD indicator (14,22,3) – the histogram and the signal line – is a supporting indicator that can also be used as a source of signals.
Important speeches and reports (always included in the news calendar) can significantly affect the movement of the currency pair. Therefore, during their release, trading should be done with utmost caution, or traders should exit the market to avoid sharp price reversals against the previous movement.
Beginning traders in the forex market should remember that not every trade can be profitable. Developing a clear strategy and effective money management are the keys to long-term trading success.