Types of trend lines
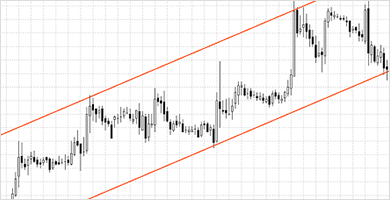
If an asset’s price makes higher highs and higher lows on a regular basis, these are signs of the upward trend.
If a price is developing an upward trend, a support line is considered the main trend line as a breakout of support southward signals completion of the trend.
Upward trend
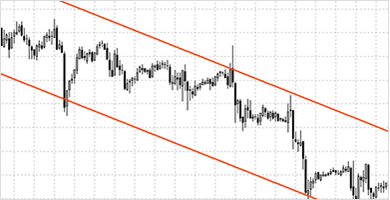
On the contrary, if an asset trades with the downward trend, a price makes lower highs and lower lows.
In case of a downward trend, a resistance line is viewed as the main trend line because a breach of resistance northward indicates a trend reversal.
Downward trend
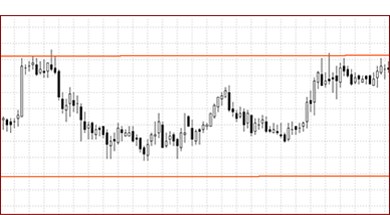
In case of the flat market, a price makes erratic moves without a clear direction. Borders of a trading range can be either horizontal or overlapping or going apart.
In case of a flat market (if an asset is trading sideways), the lines of support and resistance are of the same importance. If a price breaks out any line and holds behind it, this price action signals a beginning of an upward or downward trend.
Flat market
The rule of plotting a trend line. A trend line is drawn under pivot lows for an upward trend or over pivot highs for a downward trend. After the main trend line has been plotted (that is support for an upward trend or resistance for a downward trend), a trader should draw the second line parallel to the original line, so that a price chart is trapped between these lines. Thus, the channel consists of the two parallel lines. These are borders of the channel where a price has been moving recently. For a sideways trend, support and resistance lines do not have to be parallel.
How to build and see trend line
Open a price chart (it is recommended to open a daily chart). By zooming in and out the chart, make it show the previous market conditions and the moment when the market shifted from it to the current trend.
For example, you clearly see that the price was trading in a range for a long time, broke the upper boundary above, and the uptrend started.
Or, for instance, the downtrend dominated the market for quite a long time, but the price broke the resistance above and entered sideways trading.
Now that you see the moment when the current trend started, try to determine what it is: uptrend, downtrend, or sideways trading.
If the current market condition lasts long enough (let’s say, at least 5 days), you will likely see the resistance, support, upper, or lower range boundaries. Draw the line or lines that you see clearly.
However, the previous market condition could have been broken only recently and the new condition (new trend) has only started and has not formed its boundaries yet.
You should understand that a trend cannot develop without retracements. Long trends without retracements are very rare but still possible. If a new trend is forming, remember that the new market condition consists only of a strong movement at first and you should wait for a retracement of at least 30% or a stop in the price movement (clearly visible on a daily chart). Only after that you can build a new trend line.
How to interpret trend lines for trading
Attempts to trade against the trend are one of the key reasons why traders and investors lose their money. Keep in mind that you should trade alongside the trend during an uptrend or downtrend:
Avoid sales during an upward trend.
Refrain from buying during a downward trend.
In case of sideways trading, you can sell and you can buy, but try not to buy near the upper boundary of the range and do no sell close to the lower boundary.
Your first task is to determine the market situation according to the price chart (uptrend, downtrend, or sideways trading).
The second task is to build support and resistance lines. For the uptrend, first draw the support line at price lows. Then draw resistance above and parallel to it.
Or
During the downtrend, first build the resistance line at highs and then draw the support below parallel to it.
Or
To get a range, build a support line on lows and a resistance line on highs.
Expand
Now we see the trend and have the resistance and support line. How to use it? The best points to open a buy deal during the uptrend are near the support line (place stop loss below the support). The target is at the opposite side of the channel, at the resistance line.
Or
The best points to open a sell trade during the downward trend are near the resistance line (place stop loss above the resistance). The target is at the opposite side of the channel, at the support line.
Or
During the sideways trading, the best points to open a buy/sell deal are near the support/resistance lines with stop loss beyond the line. Targets are at the opposite side of the range.
Expand

Conclusion
Opening trades at the best points according to the current trend gives you the best profit/loss ratio for your trading. Suppose, you trade with your system that is not based on trend lines. Still, a break of support or resistance will be a signal for you that the market situation might have changed and you should consider closing deals or, on the contrary, you can expect larger profits if you stay alongside the trend.