

signal strength 1 of 5
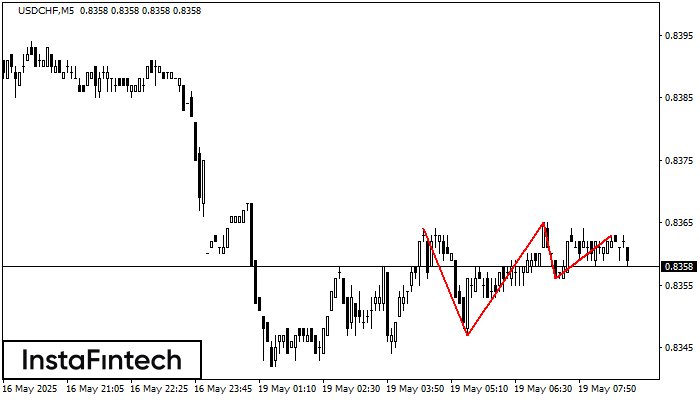
The Triple Top pattern has formed on the chart of the USDCHF M5 trading instrument. It is a reversal pattern featuring the following characteristics: resistance level 1, support level -9, and pattern’s width 17. Forecast If the price breaks through the support level 0.8347, it is likely to move further down to 0.8350.
The M5 and M15 time frames may have more false entry points.
انظر أيضا
- All
- Double Top
- Flag
- Head and Shoulders
- Pennant
- Rectangle
- Triangle
- Triple top
- All
- #AAPL
- #AMZN
- #Bitcoin
- #EBAY
- #FB
- #GOOG
- #INTC
- #KO
- #MA
- #MCD
- #MSFT
- #NTDOY
- #PEP
- #TSLA
- #TWTR
- AUDCAD
- AUDCHF
- AUDJPY
- AUDUSD
- EURCAD
- EURCHF
- EURGBP
- EURJPY
- EURNZD
- EURRUB
- EURUSD
- GBPAUD
- GBPCHF
- GBPJPY
- GBPUSD
- GOLD
- NZDCAD
- NZDCHF
- NZDJPY
- NZDUSD
- SILVER
- USDCAD
- USDCHF
- USDJPY
- USDRUB
- All
- M5
- M15
- M30
- H1
- D1
- All
- Buy
- Sale
- All
- 1
- 2
- 3
- 4
- 5
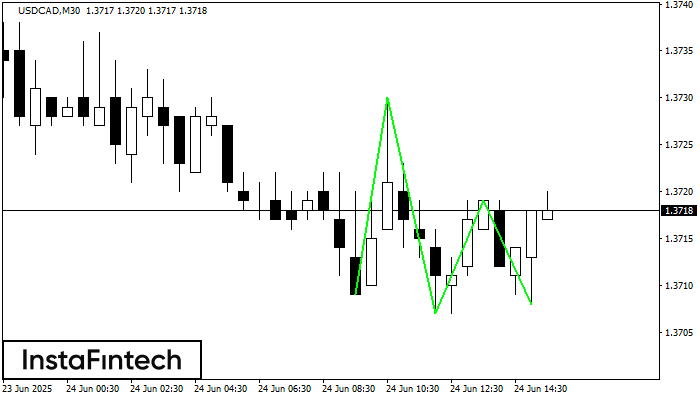
The Triple Bottom pattern has formed on the chart of USDCAD M30. Features of the pattern: The lower line of the pattern has coordinates 1.3730 with the upper limit 1.3730/1.3719
Open chart in a new window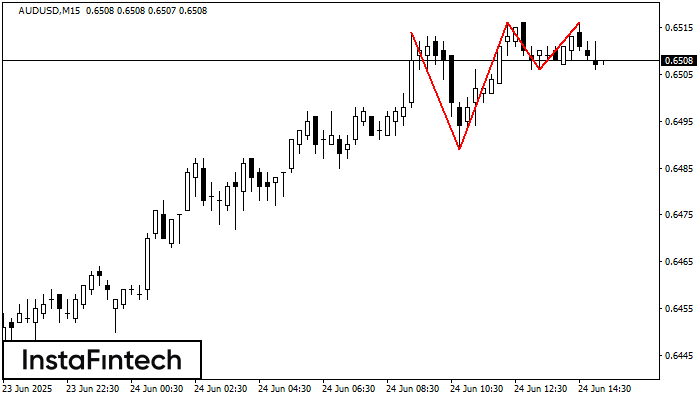
On the chart of the AUDUSD M15 trading instrument, the Triple Top pattern that signals a trend change has formed. It is possible that after formation of the third peak
The M5 and M15 time frames may have more false entry points.
Open chart in a new window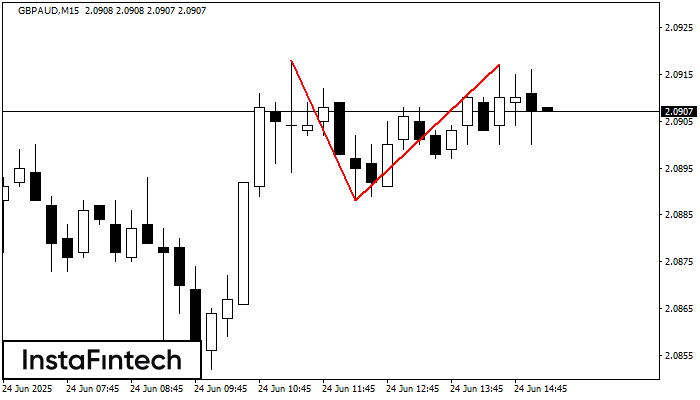
On the chart of GBPAUD M15 the Double Top reversal pattern has been formed. Characteristics: the upper boundary 2.0917; the lower boundary 2.0888; the width of the pattern 29 points
The M5 and M15 time frames may have more false entry points.
Open chart in a new window


