signal strength 1 of 5
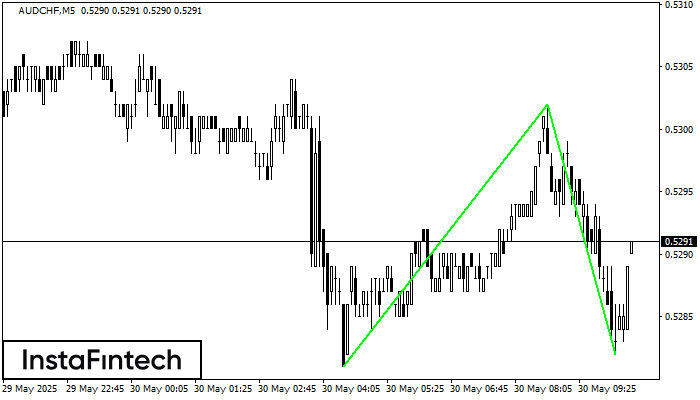
The Double Bottom pattern has been formed on AUDCHF M5. Characteristics: the support level 0.5281; the resistance level 0.5302; the width of the pattern 21 points. If the resistance level is broken, a change in the trend can be predicted with the first target point lying at the distance of 20 points.
The M5 and M15 time frames may have more false entry points.
আরও দেখুন
- All
- Double Top
- Flag
- Head and Shoulders
- Pennant
- Rectangle
- Triangle
- Triple top
- All
- #AAPL
- #AMZN
- #Bitcoin
- #EBAY
- #FB
- #GOOG
- #INTC
- #KO
- #MA
- #MCD
- #MSFT
- #NTDOY
- #PEP
- #TSLA
- #TWTR
- AUDCAD
- AUDCHF
- AUDJPY
- AUDUSD
- EURCAD
- EURCHF
- EURGBP
- EURJPY
- EURNZD
- EURRUB
- EURUSD
- GBPAUD
- GBPCHF
- GBPJPY
- GBPUSD
- GOLD
- NZDCAD
- NZDCHF
- NZDJPY
- NZDUSD
- SILVER
- USDCAD
- USDCHF
- USDJPY
- USDRUB
- All
- M5
- M15
- M30
- H1
- D1
- All
- Buy
- Sale
- All
- 1
- 2
- 3
- 4
- 5
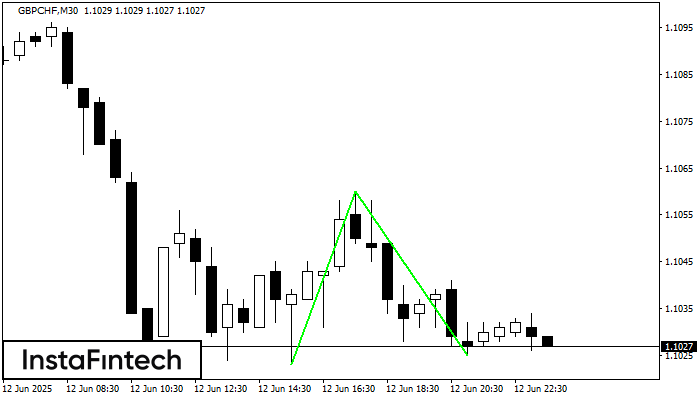
The Double Bottom pattern has been formed on GBPCHF M30. Characteristics: the support level 1.1023; the resistance level 1.1060; the width of the pattern 37 points. If the resistance level
Open chart in a new window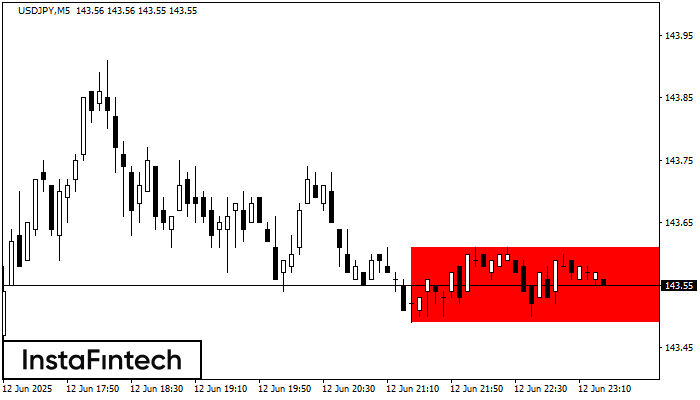
According to the chart of M5, USDJPY formed the Bearish Rectangle. The pattern indicates a trend continuation. The upper border is 143.61, the lower border is 143.49. The signal means
The M5 and M15 time frames may have more false entry points.
Open chart in a new window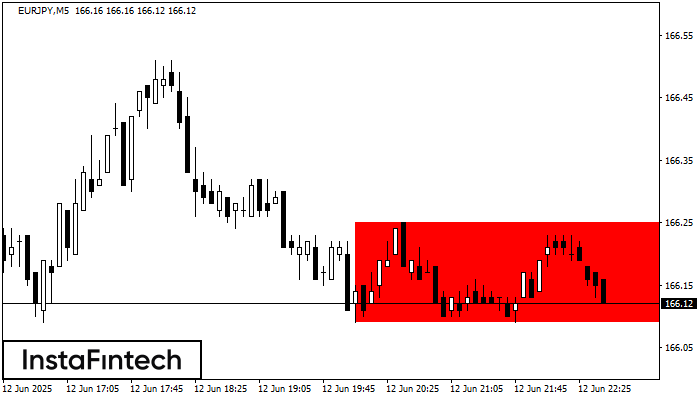
According to the chart of M5, EURJPY formed the Bearish Rectangle. The pattern indicates a trend continuation. The upper border is 166.25, the lower border is 166.09. The signal means
The M5 and M15 time frames may have more false entry points.
Open chart in a new window