

signal strength 3 of 5
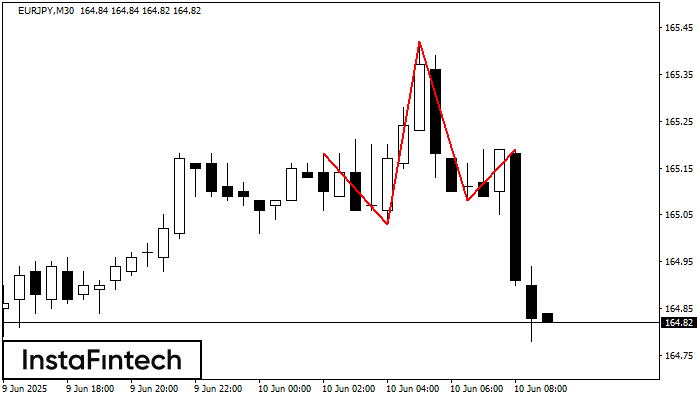
The technical pattern called Head and Shoulders has appeared on the chart of EURJPY M30. There are weighty reasons to suggest that the price will surpass the Neckline 165.03/165.08 after the right shoulder has been formed. So, the trend is set to change with the price heading for 164.78.
আরও দেখুন
- All
- Double Top
- Flag
- Head and Shoulders
- Pennant
- Rectangle
- Triangle
- Triple top
- All
- #AAPL
- #AMZN
- #Bitcoin
- #EBAY
- #FB
- #GOOG
- #INTC
- #KO
- #MA
- #MCD
- #MSFT
- #NTDOY
- #PEP
- #TSLA
- #TWTR
- AUDCAD
- AUDCHF
- AUDJPY
- AUDUSD
- EURCAD
- EURCHF
- EURGBP
- EURJPY
- EURNZD
- EURRUB
- EURUSD
- GBPAUD
- GBPCHF
- GBPJPY
- GBPUSD
- GOLD
- NZDCAD
- NZDCHF
- NZDJPY
- NZDUSD
- SILVER
- USDCAD
- USDCHF
- USDJPY
- USDRUB
- All
- M5
- M15
- M30
- H1
- D1
- All
- Buy
- Sale
- All
- 1
- 2
- 3
- 4
- 5
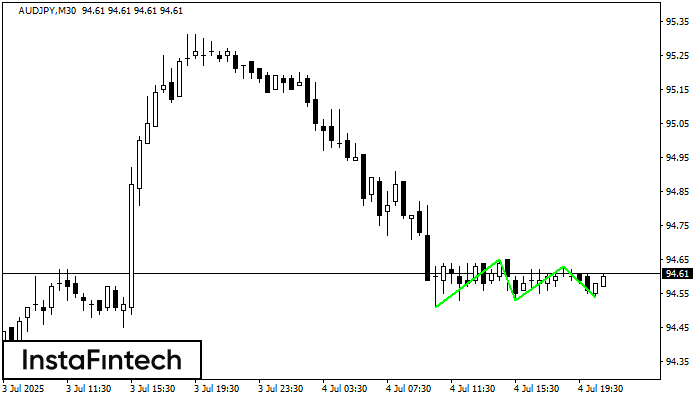
Corak Triple Bottom telah dibentuk pada carta AUDJPY M30. Ciri-ciri corak: Garisan bawah corak mempunyai koordinat 94.65 dengan had atas 94.65/94.63, unjuran lebar adalah 14 mata. Pembentukan corak Triple Bottom
Open chart in a new window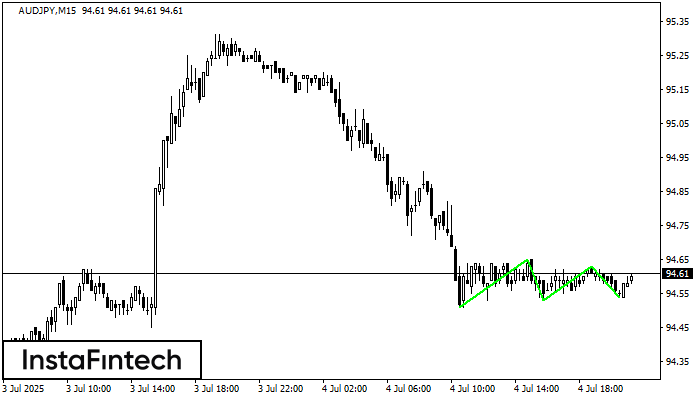
Corak Triple Bottom telah dibentuk pada carta AUDJPY M15. Ciri-ciri corak: Garisan bawah corak mempunyai koordinat 94.65 dengan had atas 94.65/94.63, unjuran lebar adalah 14 mata. Pembentukan corak Triple Bottom
Carta masa M5 dan M15 mungkin mempunyai lebih banyak titik kemasukan palsu.
Open chart in a new window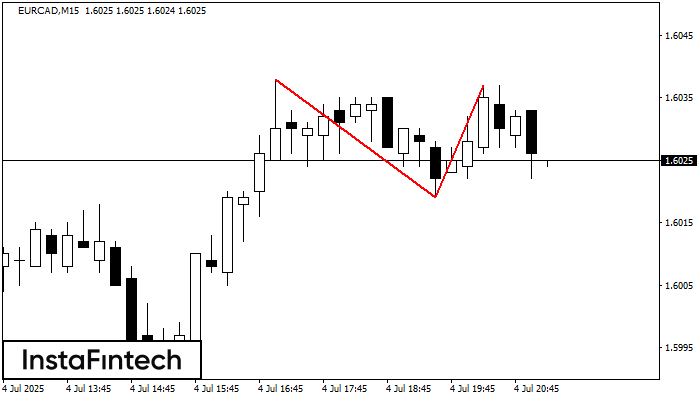
Corak Double Top telah dibentuk pada EURCAD M15. Isyarat bahawa aliran telah berubah dari aliran menaik ke aliran menurun. Mungkin, sekiranya asas corak 1.6019 ditembusi, pergerakan menurun akan berterusan
Carta masa M5 dan M15 mungkin mempunyai lebih banyak titik kemasukan palsu.
Open chart in a new window


