signal strength 1 of 5
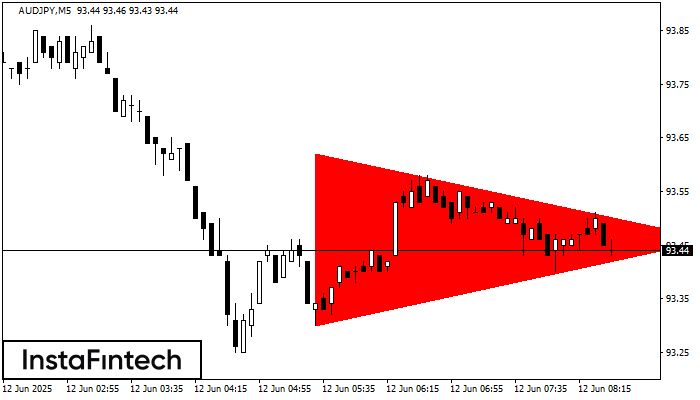
According to the chart of M5, AUDJPY formed the Bearish Symmetrical Triangle pattern. Trading recommendations: A breach of the lower border 93.30 is likely to encourage a continuation of the downward trend.
The M5 and M15 time frames may have more false entry points.
আরও দেখুন
- All
- Double Top
- Flag
- Head and Shoulders
- Pennant
- Rectangle
- Triangle
- Triple top
- All
- #AAPL
- #AMZN
- #Bitcoin
- #EBAY
- #FB
- #GOOG
- #INTC
- #KO
- #MA
- #MCD
- #MSFT
- #NTDOY
- #PEP
- #TSLA
- #TWTR
- AUDCAD
- AUDCHF
- AUDJPY
- AUDUSD
- EURCAD
- EURCHF
- EURGBP
- EURJPY
- EURNZD
- EURRUB
- EURUSD
- GBPAUD
- GBPCHF
- GBPJPY
- GBPUSD
- GOLD
- NZDCAD
- NZDCHF
- NZDJPY
- NZDUSD
- SILVER
- USDCAD
- USDCHF
- USDJPY
- USDRUB
- All
- M5
- M15
- M30
- H1
- D1
- All
- Buy
- Sale
- All
- 1
- 2
- 3
- 4
- 5
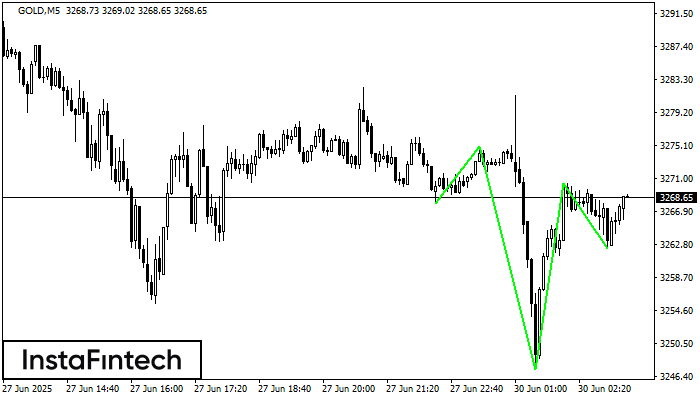
According to the chart of M5, GOLD produced the pattern termed the Inverse Head and Shoulder. The Head is fixed at 3247.25 while the median line of the Neck
The M5 and M15 time frames may have more false entry points.
Open chart in a new window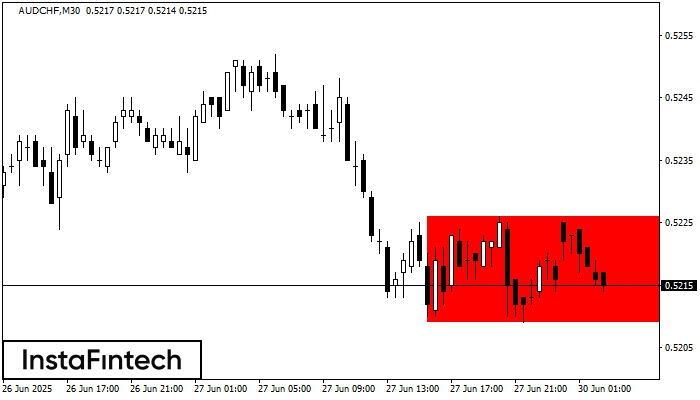
According to the chart of M30, AUDCHF formed the Bearish Rectangle. The pattern indicates a trend continuation. The upper border is 0.5226, the lower border is 0.5209. The signal means
Open chart in a new window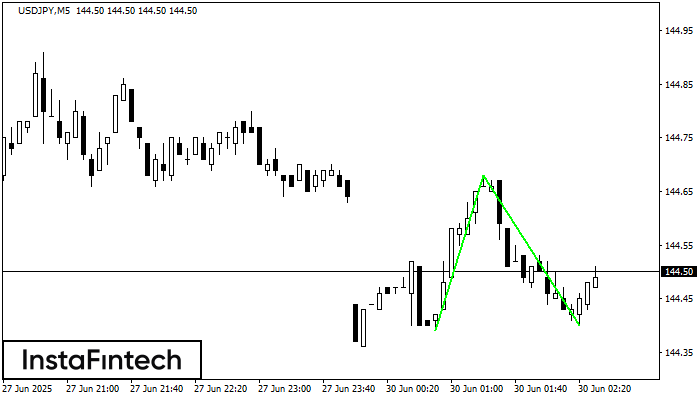
The Double Bottom pattern has been formed on USDJPY M5; the upper boundary is 144.68; the lower boundary is 144.40. The width of the pattern is 29 points. In case
The M5 and M15 time frames may have more false entry points.
Open chart in a new window