Review :
The GBP/USD pair has faced strong resistances at the levels of 1.2173 because support had become resistance on December 06, 2022. So, the strong resistance has been already formed at the level of 1.2173 and the pair is likely to try to approach it in order to test it again. However, if the pair fails to pass through the level of 1.2173, the market will indicate a bearish opportunity below the new strong resistance level of 1.2173 (the level of 1.2173 coincides with a ratio of 78% Fibonacci). Moreover, the RSI starts signaling a downward trend, as the trend is still showing strength above the moving average (100) and (50). Thus, the market is indicating a bearish opportunity below 1.2173 so it will be good to sell at 1.2173 with the first target of 1.2069. It will also call for a downtrend in order to continue towards 1.2003. The daily strong support is seen at 1.2003. The volatility is a statistical measure of a market's price movements in a given period of time. If prices for a currency have shown large instability over a short time period, then the market is highly volatile. If currencies are relatively stable, then volatility is low. In the very short term, the general bullish opinion of this analysis is in opposition with technical indicators. So long as the invalidation level of this analysis is not breached, the bullish direction is still favored, however the current short term bearish correction should be carefully watched.
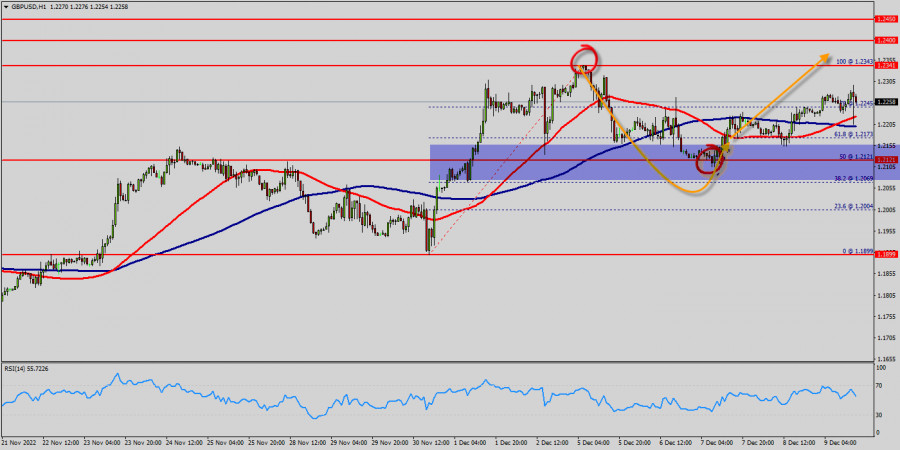
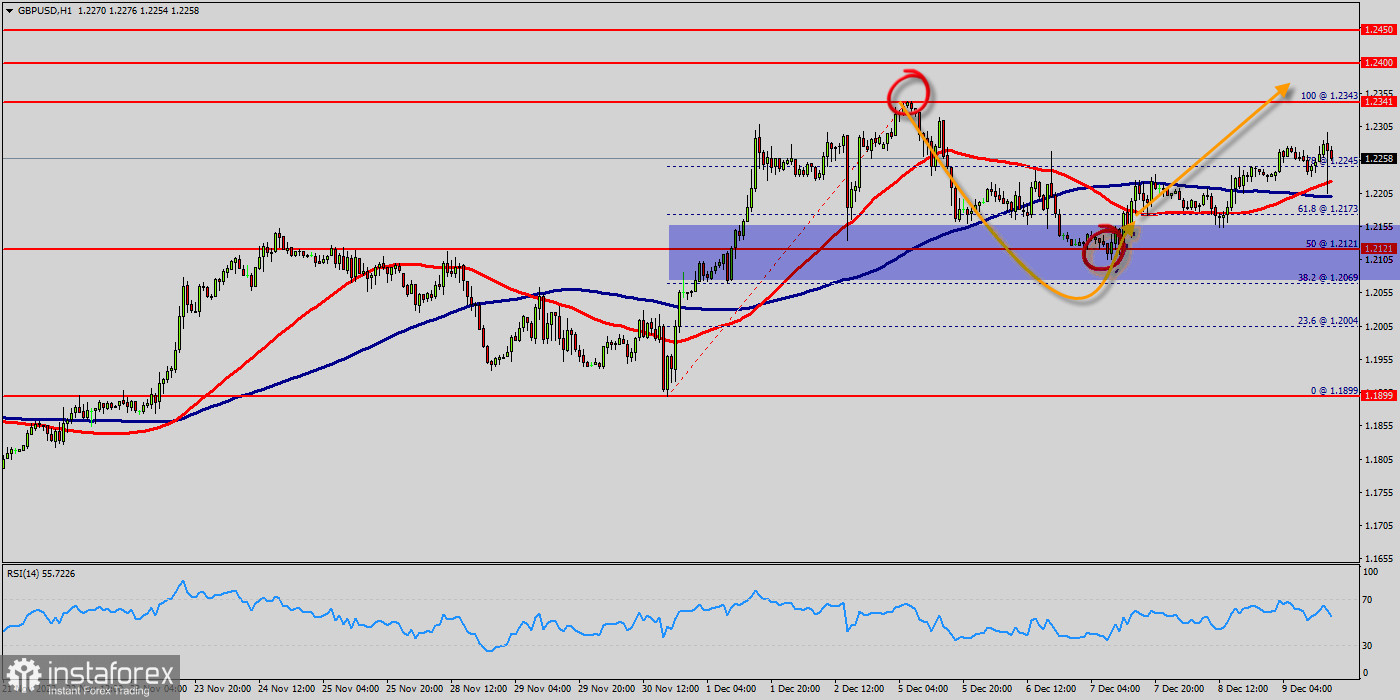
The GBP/USD pair's rise from 1.2121 is still in progress and intraday bias stays on the upside for 1.2245 resistance first on the one-hour chart. All elements being clearly bullish market, it would be possible for traders to trade only long positions on the GBP/USD pair as long as the price remains well above the price of 1.2121. The GBP/USD pair will continue rising from the level of 1.2121 in the long term. It should be noted that the support is established at the level of 1.2121 which represents the daily pivot point. The price is likely to form a double bottom in the same time frame. Accordingly, the GBP/USD pair is showing signs of strength following a breakout of the highest level of 1.2245. This suggests that the pair will probably go up in coming hours. If the trend is able to break the level of 1.2245, then the market will call for a strong bullish market towards the objectives between 1.2245 and 1.2324 this week. Currently, the price is in a bullish channel.
This is confirmed by the RSI indicator signaling that we are still in a bullish trending market. As the price is still above the moving average (100), immediate support is seen at 1.2121, which coincides with a key ratio (50% of Fibonacci). The GBP/USD pair swing around the breached resistance of the bullish channel and keeps its stability above it until now, noticing that the EMA50 continues to resistance the price from above, while RSI begins to overlap positively. Thus, the market is indicating a bullish opportunity above the above-mentioned support levels, for that the bullish outlook remains the same as long as the 100 EMA is headed to the upside. So, buy above the level of 1.2245 with the first target at 1.2341 in order to test the daily resistance 1. The buyers' bullish objective is set at the level of 1.2400.
A bullish break in this resistance would boost the bullish momentum. The buyers could then target the resistance located at 1.2400. If there is any crossing, the next objective would be the resistance located at 1.2450. The level of 1.2450 USD is a good place to take profits. Moreover, the RSI is still signaling that the trend is upward as it remains strong above the moving average (100). If the trend is be able to hit the daily pivot point (because of a market bounce in next day), it will of the wisdom to sell as the we did on the weekly strategy. Sometimes, it uses in a daily trade to stop long position and open a new short position.
It should be noted that we combine the daily pivot point, weekly pivot point strategies and sentiment analysis to trade. However, beware of bullish excesses that could lead to a possible short-term correction; but this possible correction would not be tradeable. Please do not risk any money with any of my strategies before you have proven that you do comprehend it and trade it successfully on demo at least two months. Do not try to retaliate against the market because certainly it will conquere you. New range 1.2173 - 1.2341.