empty
12.12.2022 06:32 PM
Weekly review of GBP/USD for December 12, 2022

This image is no longer relevant

Review :

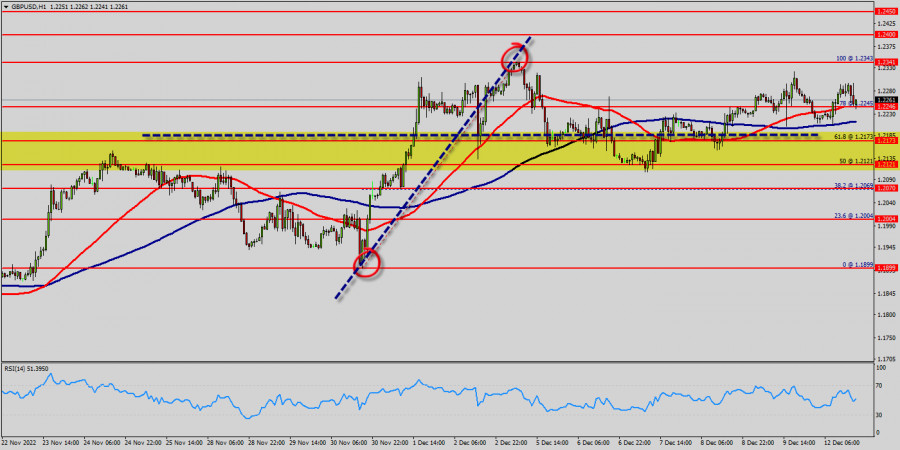
The GBP/USD pair has faced strong resistances at the levels of 1.2173 because support had become resistance on December 06, 2022. So, the strong resistance has been already formed at the level of 1.2173 and the pair is likely to try to approach it in order to test it again. However, if the pair fails to pass through the level of 1.2173, the market will indicate a bearish opportunity below the new strong resistance level of 1.2173 (the level of 1.2173 coincides with a ratio of 78% Fibonacci). Moreover, the RSI starts signaling a downward trend, as the trend is still showing strength above the moving average (100) and (50). Thus, the market is indicating a bearish opportunity below 1.2173 so it will be good to sell at 1.2173 with the first target of 1.2069. It will also call for a downtrend in order to continue towards 1.2003. The daily strong support is seen at 1.2003. The volatility is a statistical measure of a market's price movements in a given period of time. If prices for a currency have shown large instability over a short time period, then the market is highly volatile. If currencies are relatively stable, then volatility is low. In the very short term, the general bullish opinion of this analysis is in opposition with technical indicators. So long as the invalidation level of this analysis is not breached, the bullish direction is still favored, however the current short term bearish correction should be carefully watched.
This image is no longer relevant

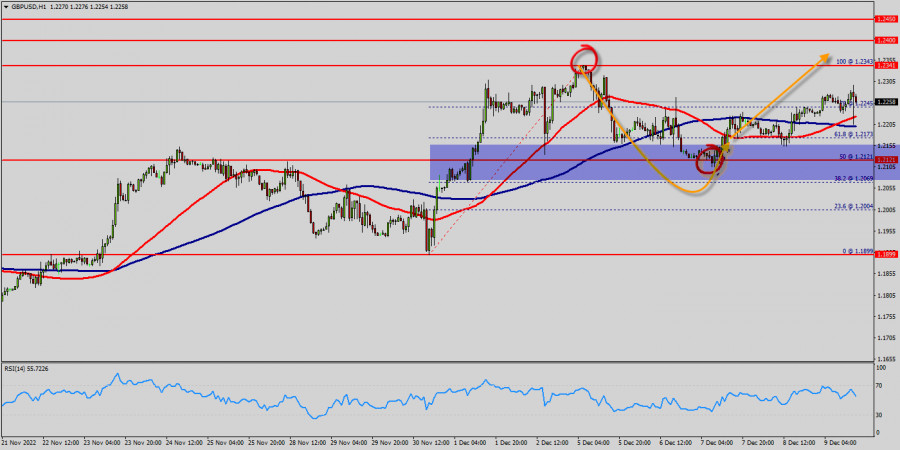
The GBP/USD pair's rise from 1.2121 is still in progress and intraday bias stays on the upside for 1.2245 resistance first on the one-hour chart. All elements being clearly bullish market, it would be possible for traders to trade only long positions on the GBP/USD pair as long as the price remains well above the price of 1.2121. The GBP/USD pair will continue rising from the level of 1.2121 in the long term. It should be noted that the support is established at the level of 1.2121 which represents the daily pivot point. The price is likely to form a double bottom in the same time frame. Accordingly, the GBP/USD pair is showing signs of strength following a breakout of the highest level of 1.2245. This suggests that the pair will probably go up in coming hours. If the trend is able to break the level of 1.2245, then the market will call for a strong bullish market towards the objectives between 1.2245 and 1.2324 this week. Currently, the price is in a bullish channel.

This is confirmed by the RSI indicator signaling that we are still in a bullish trending market. As the price is still above the moving average (100), immediate support is seen at 1.2121, which coincides with a key ratio (50% of Fibonacci). The GBP/USD pair swing around the breached resistance of the bullish channel and keeps its stability above it until now, noticing that the EMA50 continues to resistance the price from above, while RSI begins to overlap positively. Thus, the market is indicating a bullish opportunity above the above-mentioned support levels, for that the bullish outlook remains the same as long as the 100 EMA is headed to the upside. So, buy above the level of 1.2245 with the first target at 1.2341 in order to test the daily resistance 1. The buyers' bullish objective is set at the level of 1.2400.

A bullish break in this resistance would boost the bullish momentum. The buyers could then target the resistance located at 1.2400. If there is any crossing, the next objective would be the resistance located at 1.2450. The level of 1.2450 USD is a good place to take profits. Moreover, the RSI is still signaling that the trend is upward as it remains strong above the moving average (100). If the trend is be able to hit the daily pivot point (because of a market bounce in next day), it will of the wisdom to sell as the we did on the weekly strategy. Sometimes, it uses in a daily trade to stop long position and open a new short position.

It should be noted that we combine the daily pivot point, weekly pivot point strategies and sentiment analysis to trade. However, beware of bullish excesses that could lead to a possible short-term correction; but this possible correction would not be tradeable. Please do not risk any money with any of my strategies before you have proven that you do comprehend it and trade it successfully on demo at least two months. Do not try to retaliate against the market because certainly it will conquere you. New range 1.2173 - 1.2341.

Pilih timeframe
5
mnt
15
mnt
30
mnt
1
jam
4
jam
1
hari
1
minggu
Dapatkan keuntungan dari perubahan nilai mata uang kripto dengan InstaForex.
Unduh MetaTrader 4 dan buka perdagangan pertama Anda.
  • Grand Choice
    Contest by
    InstaForex
    InstaForex always strives to help you
    fulfill your biggest dreams.
    GABUNG KONTES

Artikel yang direkomendasikan

Sinyal Perdagangan untuk EMAS (XAU/USD) untuk 23-25 Juli 2024: beli di atas $2,389 (pantulan - 5/8 Murray)

Harga emas diperdagangkan di sekitar 2,402.86 di bawah kanal tren turun yang terbentuk sejak 17 Juli dan dalam kanal tren naik yang terbentuk setelah mencapai level terendah 2,384. Emas tetap

Dimitrios Zappas 17:01 2024-07-23 UTC+2

GBP/USD: tips trading untuk pemula pada sesi Eropa tanggal 25 Juni

Uji harga pada level 1.2672 terjadi ketika indikator MACD baru saja mulai naik dari tanda nol, yang mengkonfirmasi titik masuk yang benar untuk membeli pound. Akibatnya, pasangan GBP/USD naik lebih

Jakub Novak 09:11 2024-06-25 UTC+2

Analysis and trading tips for GBP/USD on April 15

Analisa transaksi dan tips trading GBP/USD Penurunan lebih lanjut menjadi terbatas karena uji harga 1.2477 terjadi pada saat garis MACD bergerak turun cukup kuat dari nol. Sebaliknya, membeli saat rebound

Jakub Novak 11:21 2024-04-16 UTC+2

Analisis Teknikal EUR/USD untuk 8 Desember 2023

EUR Tampilkan Ketahanan Sebelum Rilis Penggajian NFP Laporan Penggajian Nonpertanian, yang merupakan penggerak pasar yang penting, mengukur lapangan kerja bulanan di AS, tidak termasuk sektor-sektor tertentu. Angka yang lebih tinggi

Sebastian Seliga 11:15 2023-12-08 UTC+2

Ulasan mingguan GBP/USD pada 26-30 November 2023

Harga saat ini ditetapkan pada level 1,2423 yang bertindak sebagai titik pivot harian yang terlihat di 1,2434. Yang tak kalah penting, harga berada dalam kanal bullish. Berdasarkan kejadian sebelumnya, kami

Mourad El Keddani 02:56 2023-11-28 UTC+2

Ulasan mingguan EUR/USD pada 26-30 November 2023

Ulasan : Tren pergerakan pasangan EUR/USD kontroversial karena terjadi di kanal tren turun. Karena kejadian sebelumnya, harga masih berada di antara level 1.0850 dan 1.0773, jadi disarankan untuk berhati-hati saat

Mourad El Keddani 02:20 2023-11-28 UTC+2

Ulasan mingguan GBP/USD untuk 21 Agustus 2023

Pound Inggris naik di atas 1,2843 untuk pertama kalinya dalam setahun pada sesi Asia di hari Rabu, pound naik ke level tertinggi selama lima belas bulan sebelum kembali menguat, karena

Mourad El Keddani 03:07 2023-08-22 UTC+2

Ulasan mingguan EUR/USD untuk 21 Agustus 2023

Pasangan ini trading di atas semua moving average (100) dan (50), dengan yang lebih pendek mendapatkan traksi ke atas tepat di bawah Simple Moving Average (SMA) 50. Pasangan EUR/USD trading

Mourad El Keddani 03:07 2023-08-22 UTC+2

Weekly review of EUR/USD for July 22, 2023

The EUR/USD pair broke resistance which turned to strong support at the level of 1.1141. The level of 1.1141 coincides with 61.8% of Fibonacci, which is expected

Mourad El Keddani 08:54 2023-07-24 UTC+2

EUR/USD: pasar tunggu dorongan baru

EUR/USD Pasangan EUR/USD tiba-tiba terjebak dalam kisaran ketat. Sebelumnya, harga memperoleh momentum naik yang kuat, dan sepertinya pasar telah memilih arah. Data kemarin menunjukkan bahwa tingkat inflasi kawasan euro sebesar

Jozef Kovach 10:10 2023-07-20 UTC+2
Tidak bisa bicara sekarang?
Tanyakan pertanyaan anda lewat chat.
Widget callback
 

Dear visitor,

Your IP address shows that you are currently located in the USA. If you are a resident of the United States, you are prohibited from using the services of InstaFintech Group including online trading, online transfers, deposit/withdrawal of funds, etc.

If you think you are seeing this message by mistake and your location is not the US, kindly proceed to the website. Otherwise, you must leave the website in order to comply with government restrictions.

Why does your IP address show your location as the USA?

  • - you are using a VPN provided by a hosting company based in the United States;
  • - your IP does not have proper WHOIS records;
  • - an error occurred in the WHOIS geolocation database.

Please confirm whether you are a US resident or not by clicking the relevant button below. If you choose the wrong option, being a US resident, you will not be able to open an account with InstaForex anyway.

We are sorry for any inconvenience caused by this message.