empty
22.03.2023 11:50 PM
How to trade EUR/USD on March 23. Simple trading tips and analysis for beginners

Analyzing Wednesday's trades:

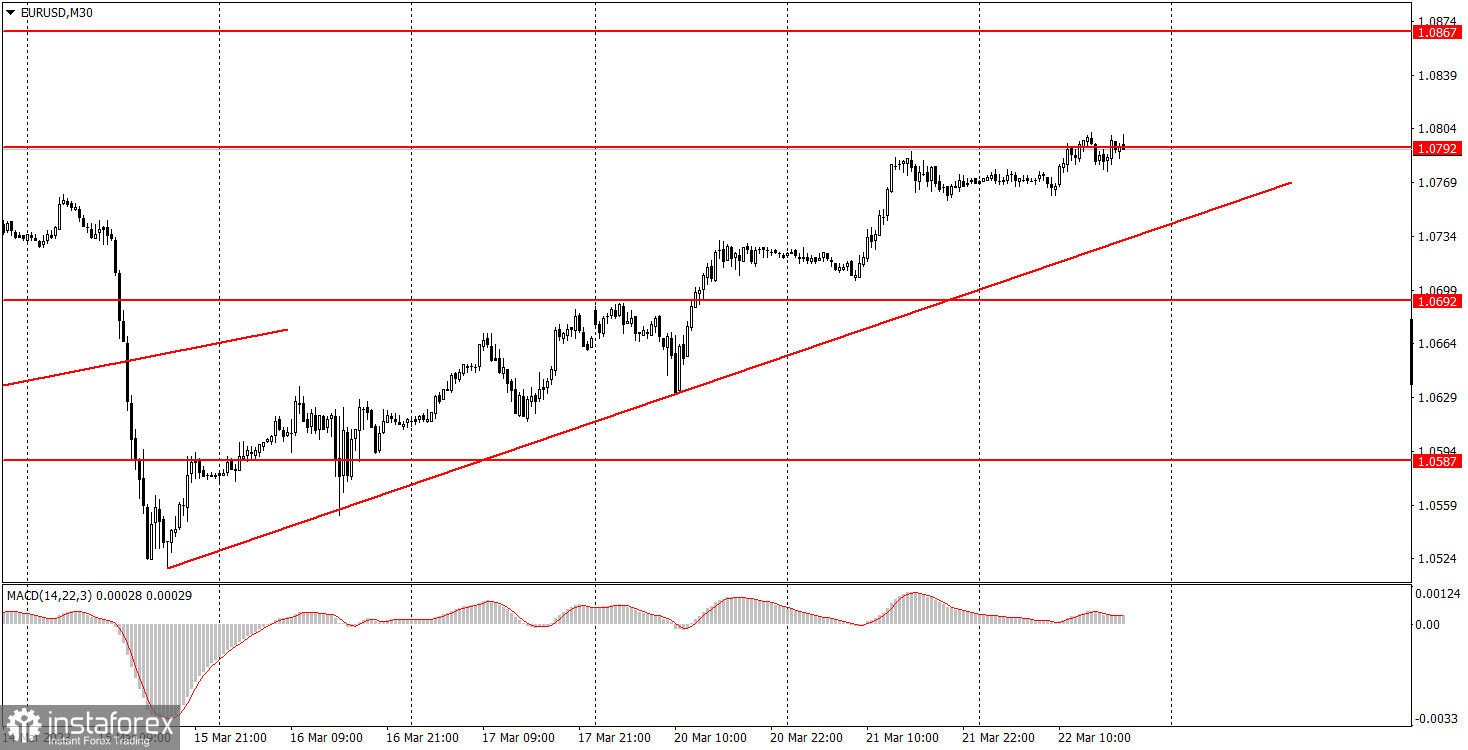
EUR/USD on 30M chart

This image is no longer relevant

EUR/USD gradually moved up on Wednesday, but during the day it was more like a flat than a trend. European Central Bank President Christine Lagarde's speech took place during the day and it was the fourth one this week. According to the pair's movements, it was obvious that traders did not react, which means that Lagarde did not give any new or important information to the market. When this article was written, we were waiting for the outcome of the Federal Reserve meeting to be announced. I thought that beginners should leave the market before that moment, because the movements can be unpredictable. It made no sense to guess what decision the US central bank will make and what rhetoric Fed Chairman Jerome Powell will announce at the press conference. No matter what decision is made, volatility will increase. The only thing left is to wait for the results, and then analyze them and make a decision.
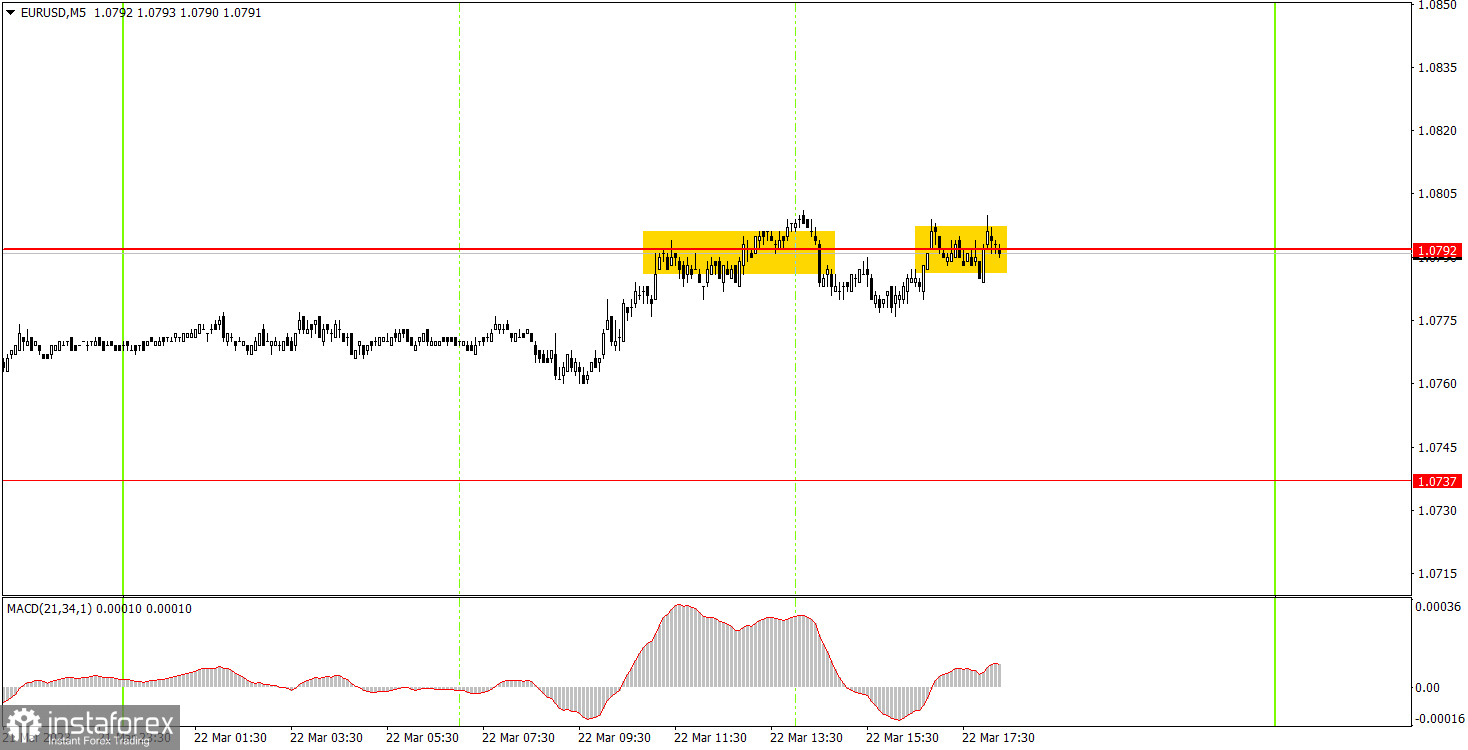
EUR/USD on 5M chart

This image is no longer relevant

Two trading signals were formed on the 5-minute chart and both of them were extremely inaccurate and weak. It is not surprising, considering that as of the moment, the total volatility of the day is 40 pips. The pair was flat for most of the day, so the signals were appropriate. Beginners could try to test only the first signal, and the second one had not even formed up to the end yet. The pair rebounded from 1.0792, and then managed to edge down by 7 points. What is interesting is that it failed to rise above 1.0792 till the evening, so there was no buy signal, so there was no reason to close the short position. But, of course, it should be closed. The loss on it, if there was, turned out to be small.

Trading tips on Thursday:

On the 30-minute chart, the pair continues to form a new uptrend, as evidenced by the ascending trend line. Considering the "swing state" in the long term, the pair can move in any direction regardless of the macroeconomic background, trend lines and "fundamentals". Even consolidating below the trend line does not guarantee that a powerful downward movement will start, but at least it serves as a guide for now. On the 5-minute chart, it is recommended to trade at the levels 1.0433, 1.0465-1.0483, 1.0535, 1.0587-1.0607, 1.0692, 1.0737, 1.0792, 1.0857-1.0867, 1.0920-1.0933. As soon as the price passes 15 pips in the right direction, you should set a Stop Loss to breakeven. There are no interesting events scheduled for Thursday in the European Union, and there will only be minor reports in the US. However, the market may still be under the impression of the results of the Fed meeting, so the movements could be strong.

Basic rules of the trading system:

1) The strength of the signal is determined by the time it took the signal to form (a rebound or a breakout of the level). The quicker it is formed, the stronger the signal is.

2) If two or more positions were opened near a certain level based on a false signal (which did not trigger a Take Profit or test the nearest target level), then all subsequent signals at this level should be ignored.

3) When trading flat, a pair can form multiple false signals or not form them at all. In any case, it is better to stop trading at the first sign of a flat movement.

4) Trades should be opened in the period between the start of the European session and the middle of the US trading hours when all positions must be closed manually.

5) You can trade using signals from the MACD indicator on the 30-minute time frame only amid strong volatility and a clear trend that should be confirmed by a trendline or a trend channel.

6) If two levels are located too close to each other (from 5 to 15 pips), they should be considered support and resistance levels.

On the chart:

Support and Resistance levels are the levels that serve as targets when buying or selling the pair. You can place Take Profit near these levels.

Red lines are channels or trend lines that display the current trend and show in which direction it is better to trade now.

The MACD indicator (14, 22, and 3) consists of a histogram and a signal line. When they cross, this is a signal to enter the market. It is recommended to use this indicator in combination with trend patterns (channels and trendlines).

Important announcements and economic reports that can be found on the economic calendar can seriously influence the trajectory of a currency pair. Therefore, at the time of their release, we recommend trading as carefully as possible or exiting the market in order to avoid sharp price fluctuations.

Beginners on Forex should remember that not every single trade has to be profitable. The development of a clear strategy and money management is the key to success in trading over a long period of time.

Seleccione el marco de tiempo
5
min
15
min
30
min
1
hora
4
horas
1
día
1
s.
Gana con los cambios en el valor de las criptomonedas con InstaForex.
Descarga MetaTrader 4 y abre tu primera operación.
  • Grand Choice
    Contest by
    InstaForex
    InstaForex always strives to help you
    fulfill your biggest dreams.
    UNIRSE AL CONCURSO

Recommended Stories

Ayer se formaron varios puntos de entrada al mercado. Vamos a mirar el gráfico de 5 minutos y analizar lo que ocurrió. En mi pronóstico matutino presté atención al nivel

Miroslaw Bawulski 08:47 2025-06-05 UTC+2

EUR/USD: plan para la sesión europea del 5 de junio. Informes COT (Commitment of Traders) (análisis de las operaciones de ayer). El euro se beneficia de la debilidad del dólar

EUR/USD: plan para la sesión europea del 5 de junio. Informes COT (Commitment of Traders) (análisis de las operaciones de ayer). El euro se beneficia de la debilidad del dólar

Miroslaw Bawulski 08:46 2025-06-05 UTC+2

GBP/USD: plan para la sesión europea del 4 de junio. Informes COT (Commitment of Traders) (análisis de las operaciones de ayer). Demostrar un crecimiento es cada vez más difícil

Ayer se formaron varios puntos de entrada al mercado. Veamos el gráfico de 5 minutos y analicemos lo que ocurrió allí. En mi pronóstico matutino presté atención al nivel

Miroslaw Bawulski 08:27 2025-06-04 UTC+2

EUR/USD: plan para la sesión europea del 4 de junio. Informes COT (Commitment of Traders) (análisis de las operaciones de ayer). El euro no mantuvo las posiciones

Ayer se formó solo un punto de entrada al mercado. Veamos el gráfico de 5 minutos y analicemos lo que ocurrió allí. En mi pronóstico matutino presté atención al nivel

Miroslaw Bawulski 08:27 2025-06-04 UTC+2

GBP/USD: plan para la sesión europea del 3 de junio. Informes COT (Commitment of Traders) (análisis de las operaciones de ayer). La libra se mantiene en el canal

Ayer se formaron varios puntos de entrada al mercado. Veamos el gráfico de 5 minutos y analicemos que ocurrió. En mi pronóstico matutino presté atención al nivel 1.3555 y planeé

Miroslaw Bawulski 07:22 2025-06-03 UTC+2

EUR/USD: plan para la sesión europea del 3 de junio. Informes COT (Commitment of Traders) (análisis de las operaciones de ayer). El euro actualiza el máximo mensual

Ayer se formaron varios puntos de entrada al mercado. Veamos el gráfico de 5 minutos y analicemos que ocurrió. En mi pronóstico matutino presté atención al nivel 1.1416 y planeé

Miroslaw Bawulski 07:22 2025-06-03 UTC+2

GBP/USD: plan para la sesión europea del 2 de junio. Informes COT (Commitment of Traders) (análisis de las operaciones de ayer). La libra no cesa en sus intentos de subir

GBP/USD: plan para la sesión europea del 2 de junio. Informes COT (Commitment of Traders) (análisis de las operaciones de ayer). La libra no cesa en sus intentos de subir

Miroslaw Bawulski 08:29 2025-06-02 UTC+2

EUR/USD: plan para la sesión europea del 2 de junio. Informes COT (Commitment of Traders) (análisis de las operaciones de ayer). El euro no se rinde

El pasado viernes se formaron varios puntos de entrada al mercado. Veamos el gráfico de 5 minutos y analicemos lo que ocurrió allí. En mi pronóstico matutino presté atención

Miroslaw Bawulski 08:29 2025-06-02 UTC+2

GBP/USD: plan para la sesión europea del 28 de mayo. Informes COT (análisis de las operaciones de ayer) La libra sigue perdiendo terreno

Ayer se formaron varios puntos de entrada al mercado. Veamos el gráfico de 5 minutos y analicemos lo que ocurrió. En mi pronóstico matutino, presté atención al nivel 1.3545

Miroslaw Bawulski 08:07 2025-05-28 UTC+2

EUR/USD: plan para la sesión europea del 28 de mayo. Informes COT (análisis de las operaciones de ayer) El euro continúa cayendo

Ayer se formaron varios puntos de entrada al mercado. Veamos el gráfico de 5 minutos y analicemos lo que ocurrió. En mi pronóstico matutino, presté atención al nivel 1.1374

Miroslaw Bawulski 08:07 2025-05-28 UTC+2
¿No puede hablar ahora mismo?
Ingrese su pregunta en el chat.
Widget callback
 

Dear visitor,

Your IP address shows that you are currently located in the USA. If you are a resident of the United States, you are prohibited from using the services of InstaFintech Group including online trading, online transfers, deposit/withdrawal of funds, etc.

If you think you are seeing this message by mistake and your location is not the US, kindly proceed to the website. Otherwise, you must leave the website in order to comply with government restrictions.

Why does your IP address show your location as the USA?

  • - you are using a VPN provided by a hosting company based in the United States;
  • - your IP does not have proper WHOIS records;
  • - an error occurred in the WHOIS geolocation database.

Please confirm whether you are a US resident or not by clicking the relevant button below. If you choose the wrong option, being a US resident, you will not be able to open an account with InstaForex anyway.

We are sorry for any inconvenience caused by this message.