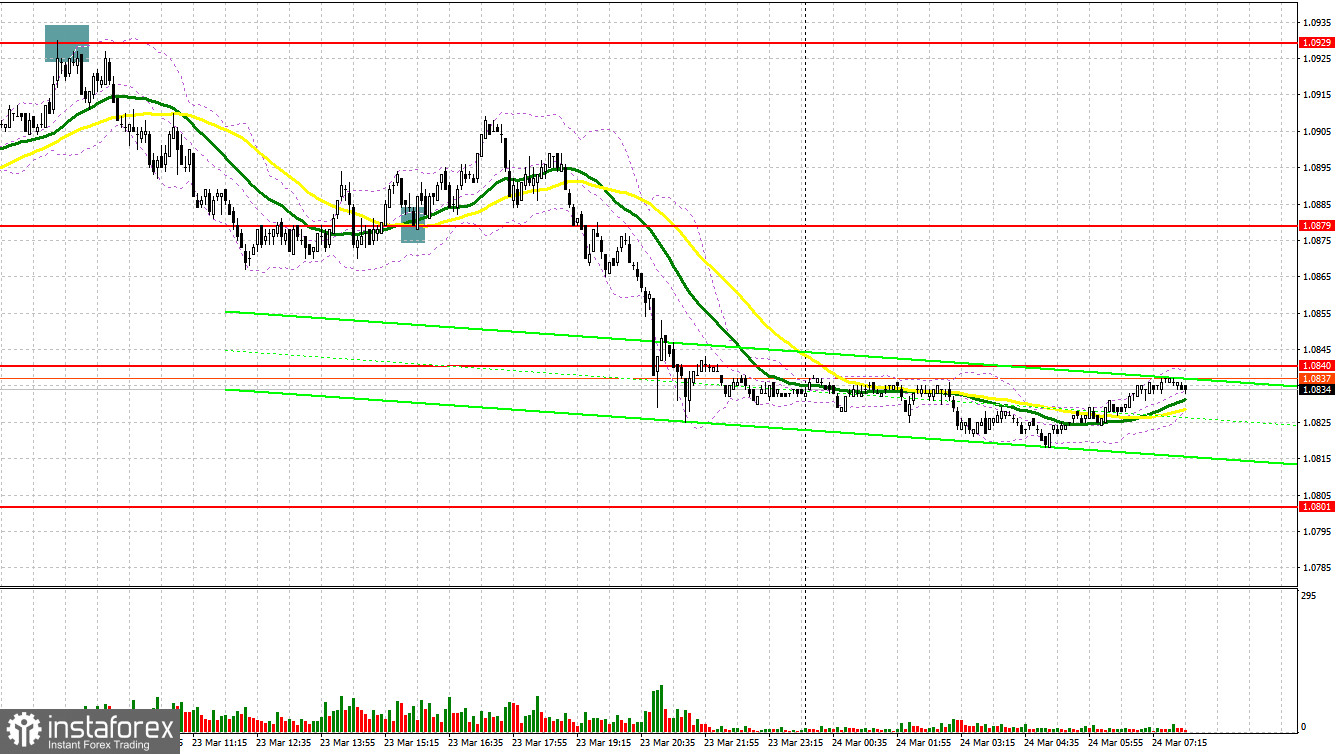
Yesterday, traders received several signals to enter the market. Let us take a look at the 5-minute chart to figure out what happened. Earlier, I asked you to pay attention to the level of 1.0929 to decide when to enter the market. Growth and a false breakout at 1.0929 gave a sell signal, after which the euro sank by more than 50 pips. In the second part of the day, after falling to 1.0879, a false breakout led to a buy signal, thus allowing the pair to climb by more than 25 pips.
Conditions for opening long positions on EUR/USD:
The volume of long positions on the euro is gradually decreasing, which can only aggravate today's bearish correction. Back at the beginning of March, we were speculating that this month would be quite favorable for risky assets. But March is coming to an end and it is time to think about how to act next. I believe the bearish correction will persist today especially if traders ignore the eurozone macro data. Eurozone PMIs for the manufacturing and services sectors will be released today. The data is expected to be bearable so we can expect the pair to advance in the first part of the day. In case the euro falls further, it will be wise to go long after a false breakout near a new support level of 1.0801. Strong data from eurozone countries can push the euro to climb to the nearest resistance at 1.0840. A breakout and a downward test of this level will give a buy signal with the target at 1.0879, which is in line with the bearish moving averages. At this level, the bulls will have a tough time. Meanwhile, a breakout of 1.0879 will affect bears' stop orders and intensify the bullish trend. In this case, traders will get one more buy signal with the target at 1.0929, where it is better to lock in profits. If the EUR/USD falls and bulls fail to protect 1.0801, pressure on the euro will return. A breakout of this level will cause a drop in the pair to the next support level of 1.0761. This can affect the overall market situation. Only a false breakout of this level will form a buy signal. Traders may also go long just after a bounce off the low of 1.0724 or even lower – at 1.0691, expecting a rise of 30-35 pips.
Conditions for opening short positions on EUR/USD:
The bears managed to cope with the targets and now they are looking at the next support level at 1.0801. First of all, bears should protect the nearest resistance level of 1.0840. Since we expect to receive good macro data on eurozone countries in the first part of the day, it will be wise to open short positions after a false breakout at 1.0840, which may lead to a decline in the euro to the nearest support level of 1.0801. A breakout and a reverse test of this range may cause a decline in the pair, which will form an additional sell signal with the target at 1.0761. If the price settles below this level after strong US data, it may slide to 1.0724, which can bring back the bearish sentiment in the market. I will also lock in profits here. If EUR/USD rises during the European session and bears fail to protect 1.0840, it is better to avoid selling the asset until the price touches 1.0879. There, it will be possible to sell only after a false breakout. Traders may also go short just after a rebound from the high of 1.0929, expecting a decline of 30-35 pips.
COT report:
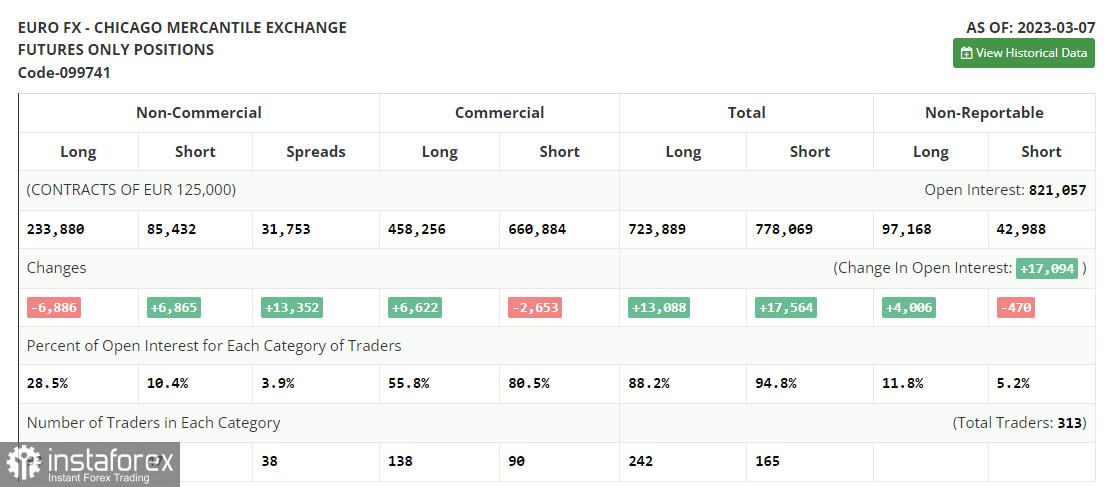
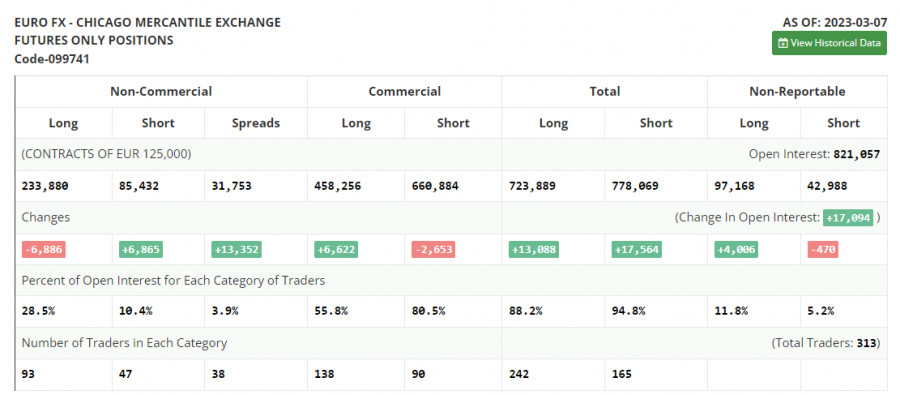
According to the COT report from March 7, the number of long positions dropped, whereas the number of short positions increased. Notably, the data is of zero importance at the moment as it was relevant two weeks ago. The CFTC is still recovering after a cyberattack. It is better to wait for new reports. This week, the Federal Reserve will hold a meeting, during which it may pause the monetary policy tightening. The fact is that the problems in the banking sector and the launch of a new credit swap line to support other banks with liquidity may seriously affect the economy. If Jerome Powell decides to raise the key rate higher, the US dollar is unlikely to receive support. Traders are pricing in the Fed's switch to a less hawkish stance and monetary policy loosening by the end of the year. The COT report unveiled that the number of long non-commercial positions dropped by 6,886 to 233,880, while the number of short non-commercial positions increased by 6,865 to 85,432. At the end of the week, the total non-commercial net position decreased to 148,448 against 165,038. The weekly closing price dropped to 1.0555 against 1.0698.
Signals of indicators:
Moving Averages
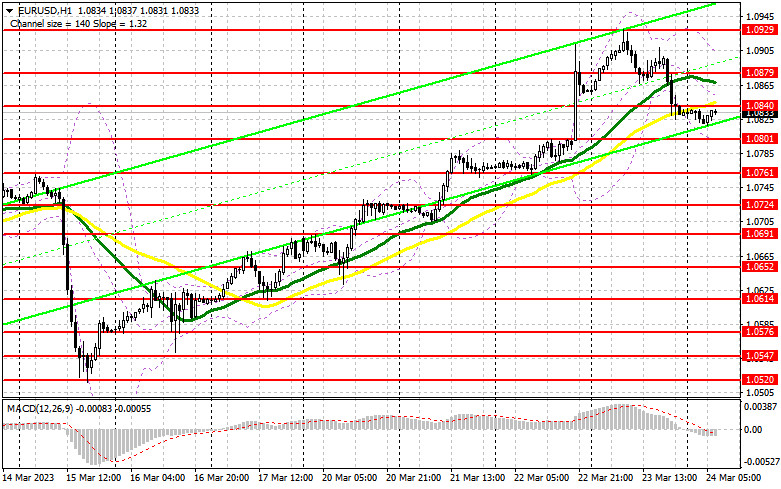
Trading is performed below the 30- and 50-day moving averages, which indicates a reversal.
Note: The author considers the period and prices of moving averages on the one-hour chart which differs from the general definition of the classic daily moving averages on the daily chart.
Bollinger Bands
In case of a decline, the lower limit of the indicator located around 1.0801 will act as support.
Description of indicators
- Moving average (a moving average determines the current trend by smoothing volatility and noise). The period is 50. It is marked in yellow on the chart.
- Moving average (a moving average determines the current trend by smoothing volatility and noise). The period is 30. It is marked in green on the graph.
- MACD indicator (Moving Average Convergence/Divergence - convergence/divergence of moving averages). A fast EMA period is 12. A slow EMA period is 26. The SMA period is 9.
- Bollinger Bands. The period is 20.
- Non-profit speculative traders are individual traders, hedge funds, and large institutions that use the futures market for speculative purposes and meet certain requirements.
- Long non-commercial positions are the total number of long positions opened by non-commercial traders.
- Short non-commercial positions are the total number of short positions opened by non-commercial traders.
- The total non-commercial net position is a difference in the number of short and long positions opened by non-commercial traders.