empty
01.06.2023 04:00 PM
S&P 500 Outlook for June 1, 2023

This image is no longer relevant

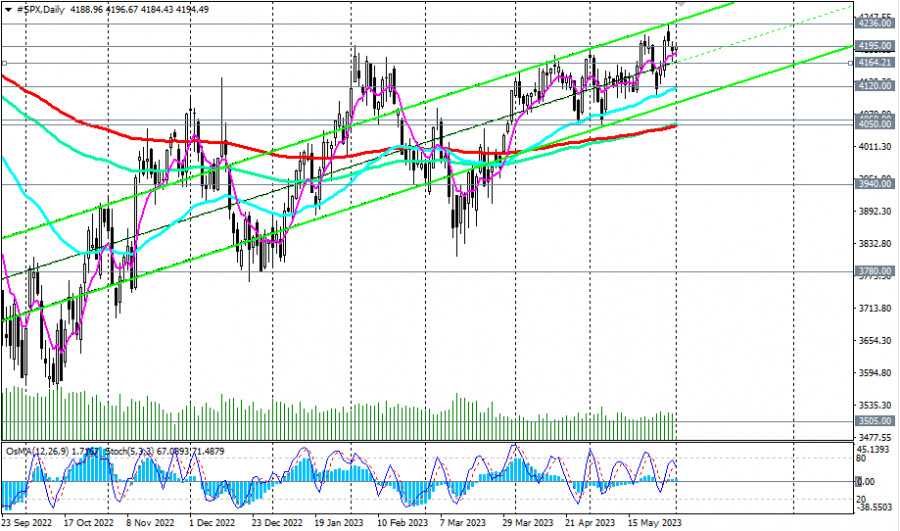
Futures on the broad-market U.S. stock index S&P 500 (CFD #SPX in the trading terminal) maintain a positive momentum, trading in the bullish market zone above key support levels 4060.00 (50 EMA on the weekly chart) and 4050.00 (200 EMA on the daily chart).

Despite the "hawkish" statements from Federal Reserve representatives regarding the prospects of monetary policy, economists believe that it remains accommodative, considering high inflation and a strong labor market. Moreover, the U.S. stock market seems to have turned upward again after the March Federal Reserve meeting, when economists' opinions about the soon-to-be paused tightening cycle gained more prominence. Federal Reserve Chairman Jerome Powell noted that recently received inflation data "indeed indicate the long-awaited easing of price pressures." Although, in his opinion, "much more evidence is needed to be confident about inflation easing."

This image is no longer relevant

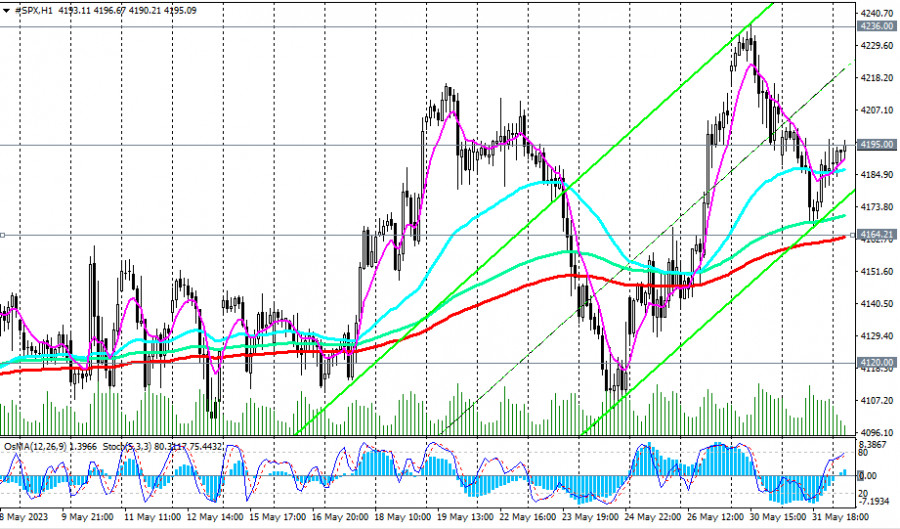
Nevertheless, at the moment, S&P 500 futures are trading near the level of 4195.00. A breakout of this local resistance level and last month's high at 4236.00 will serve as additional evidence in favor of a revival of the global bullish trend in the S&P 500. Above the important short-term support level 4120.00 (200 EMA on the 4-hour chart and 50 EMA on the daily chart), long positions remain intact.

However, a breakthrough of these levels will signal to traders who trade "short" on the S&P500, with the earliest selling signal being a breakout of the short-term support level 4164.00 (200 EMA on the 1-hour chart).

This image is no longer relevant

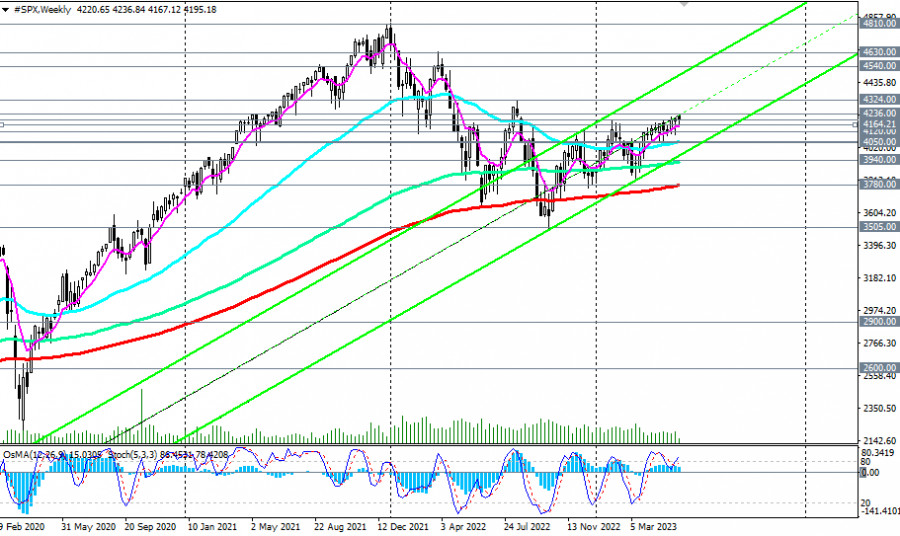
A breakout of the key support level 4050.00 (200 EMA, 144 EMA on the daily chart) will increase the risks of breaking the medium-term bullish market, while a breakout of the support level 3780.00 (200 EMA on the weekly chart) will indicate a long-term breakdown.

However, only a breakthrough of strategic support levels 2900.00 (144 EMA on the monthly chart) and 2600.00 (200 EMA on the monthly chart) would indicate a break in the long-term global bullish trend in the S&P500.

Overall, the "buy-and-hold" strategy remains relevant for the U.S. stock market and its index, the S&P500.

Support levels: 4164.00, 4120.00, 4100.00, 4060.00, 4050.00, 4000.00, 3940.00, 3800.00, 3780.00, 3700.00, 3600.00, 3505.00

Resistance levels: 4195.00, 4236.00, 4324.00, 4540.00, 4630.00, 4810.00

Seleccione el marco de tiempo
5
min
15
min
30
min
1
hora
4
horas
1
día
1
s.
Gana con los cambios en el valor de las criptomonedas con InstaForex.
Descarga MetaTrader 4 y abre tu primera operación.
  • Grand Choice
    Contest by
    InstaForex
    InstaForex always strives to help you
    fulfill your biggest dreams.
    UNIRSE AL CONCURSO

Recommended Stories

Ayer se formaron varios puntos de entrada al mercado. Vamos a mirar el gráfico de 5 minutos y analizar lo que ocurrió. En mi pronóstico matutino presté atención al nivel

Miroslaw Bawulski 08:47 2025-06-05 UTC+2

EUR/USD: plan para la sesión europea del 5 de junio. Informes COT (Commitment of Traders) (análisis de las operaciones de ayer). El euro se beneficia de la debilidad del dólar

EUR/USD: plan para la sesión europea del 5 de junio. Informes COT (Commitment of Traders) (análisis de las operaciones de ayer). El euro se beneficia de la debilidad del dólar

Miroslaw Bawulski 08:46 2025-06-05 UTC+2

GBP/USD: plan para la sesión europea del 4 de junio. Informes COT (Commitment of Traders) (análisis de las operaciones de ayer). Demostrar un crecimiento es cada vez más difícil

Ayer se formaron varios puntos de entrada al mercado. Veamos el gráfico de 5 minutos y analicemos lo que ocurrió allí. En mi pronóstico matutino presté atención al nivel

Miroslaw Bawulski 08:27 2025-06-04 UTC+2

EUR/USD: plan para la sesión europea del 4 de junio. Informes COT (Commitment of Traders) (análisis de las operaciones de ayer). El euro no mantuvo las posiciones

Ayer se formó solo un punto de entrada al mercado. Veamos el gráfico de 5 minutos y analicemos lo que ocurrió allí. En mi pronóstico matutino presté atención al nivel

Miroslaw Bawulski 08:27 2025-06-04 UTC+2

GBP/USD: plan para la sesión europea del 3 de junio. Informes COT (Commitment of Traders) (análisis de las operaciones de ayer). La libra se mantiene en el canal

Ayer se formaron varios puntos de entrada al mercado. Veamos el gráfico de 5 minutos y analicemos que ocurrió. En mi pronóstico matutino presté atención al nivel 1.3555 y planeé

Miroslaw Bawulski 07:22 2025-06-03 UTC+2

EUR/USD: plan para la sesión europea del 3 de junio. Informes COT (Commitment of Traders) (análisis de las operaciones de ayer). El euro actualiza el máximo mensual

Ayer se formaron varios puntos de entrada al mercado. Veamos el gráfico de 5 minutos y analicemos que ocurrió. En mi pronóstico matutino presté atención al nivel 1.1416 y planeé

Miroslaw Bawulski 07:22 2025-06-03 UTC+2

GBP/USD: plan para la sesión europea del 2 de junio. Informes COT (Commitment of Traders) (análisis de las operaciones de ayer). La libra no cesa en sus intentos de subir

GBP/USD: plan para la sesión europea del 2 de junio. Informes COT (Commitment of Traders) (análisis de las operaciones de ayer). La libra no cesa en sus intentos de subir

Miroslaw Bawulski 08:29 2025-06-02 UTC+2

EUR/USD: plan para la sesión europea del 2 de junio. Informes COT (Commitment of Traders) (análisis de las operaciones de ayer). El euro no se rinde

El pasado viernes se formaron varios puntos de entrada al mercado. Veamos el gráfico de 5 minutos y analicemos lo que ocurrió allí. En mi pronóstico matutino presté atención

Miroslaw Bawulski 08:29 2025-06-02 UTC+2

GBP/USD: plan para la sesión europea del 28 de mayo. Informes COT (análisis de las operaciones de ayer) La libra sigue perdiendo terreno

Ayer se formaron varios puntos de entrada al mercado. Veamos el gráfico de 5 minutos y analicemos lo que ocurrió. En mi pronóstico matutino, presté atención al nivel 1.3545

Miroslaw Bawulski 08:07 2025-05-28 UTC+2

EUR/USD: plan para la sesión europea del 28 de mayo. Informes COT (análisis de las operaciones de ayer) El euro continúa cayendo

Ayer se formaron varios puntos de entrada al mercado. Veamos el gráfico de 5 minutos y analicemos lo que ocurrió. En mi pronóstico matutino, presté atención al nivel 1.1374

Miroslaw Bawulski 08:07 2025-05-28 UTC+2
¿No puede hablar ahora mismo?
Ingrese su pregunta en el chat.
Widget callback
 

Dear visitor,

Your IP address shows that you are currently located in the USA. If you are a resident of the United States, you are prohibited from using the services of InstaFintech Group including online trading, online transfers, deposit/withdrawal of funds, etc.

If you think you are seeing this message by mistake and your location is not the US, kindly proceed to the website. Otherwise, you must leave the website in order to comply with government restrictions.

Why does your IP address show your location as the USA?

  • - you are using a VPN provided by a hosting company based in the United States;
  • - your IP does not have proper WHOIS records;
  • - an error occurred in the WHOIS geolocation database.

Please confirm whether you are a US resident or not by clicking the relevant button below. If you choose the wrong option, being a US resident, you will not be able to open an account with InstaForex anyway.

We are sorry for any inconvenience caused by this message.