Yesterday, several excellent entry signals were formed in the market. Let's look at the 5-minute chart and analyze what happened. In my morning forecast, I highlighted the level of 1.0705 and recommended making trading decisions with this level in mind. The decline and the formation of a false breakout at this level resulted in a buy signal, leading to an upward movement of over 30 pips. In the second half of the day, the false breakout and a sell signal at 1.0739 resulted in losses as the euro failed to reverse upwards.
When to open long positions on EUR/USD:
The revised GDP report for the Eurozone in the first quarter of 2023 had little impact on the euro, while a sharp increase in the number of US unemployment claims triggered dollar selling in the second half of the day. Today, apart from speeches by ECB Vice President Luis de Guindos and Andrea Enria, the Chair of the Supervisory Board of the European Central Bank, there are no other key events, so traders should be cautious with opening long positions as bulls may quickly lose their advantage. For this reason, action will only be taken on a decline towards the intermediate support at 1.0768, which was formed based on yesterday's performance. A false breakout of this level would create a buy signal, allowing the pair to reach a new weekly high around 1.0800. A breakout and a downward retest of this range would increase the demand for EUR, maintaining its chance to rise to 1.0830. The level of 1.0870 remains the most distant target, where I will take profit.
If EUR/USD declines and bulls are idle at 1.0768, which is more likely to occur in the first half of the day, pressure on the pair will significantly increase, and bears will attempt to erase yesterday's gains. Therefore, only the formation of a false breakout of the next support level of 1.0736, where the moving averages favor the bulls, would provide a buy signal for the euro. I will open long positions immediately if EUR/USD bounces off the low at 1.0705, targeting an upward intraday correction of 30-35 pips.
When to open short positions on EUR/USD:
The bears failed to act in any way, allowing the pair to break above the upper boundary of the sideways channel, triggering stop loss orders and leading to a sharp rise in the euro. Today, bearish traders can only rely on dovish statements from European Central Bank officials and the defense of resistance at 1.0800, where the pair is currently heading. A false breakout at this level would provide a sell signal capable of pushing EUR/USD towards 1.0768, which is an intermediate support playing an important role in the pair's daily direction. Consolidation below this range, as well as a reverse test from below to above, would pave the way to 1.0736. The ultimate target would be the minimum at 1.0705, where I will take profits.
If EUR/USD rises during the European session and bears are idle around 1.0800, bulls will continue to build a new upward trend, capitalizing on Fed rate hike pause expectations, which may be announced next week. In that case, I will postpone going short on the pair until it reaches the next resistance level of 1.0830. New short positions can also be opened there, but only after a failed consolidation. I will open short positions immediately if EUR/USD bounces off the high of 1.0870, targeting a downward correction of 30-35 pips.
Commitment of Traders (COT) report:
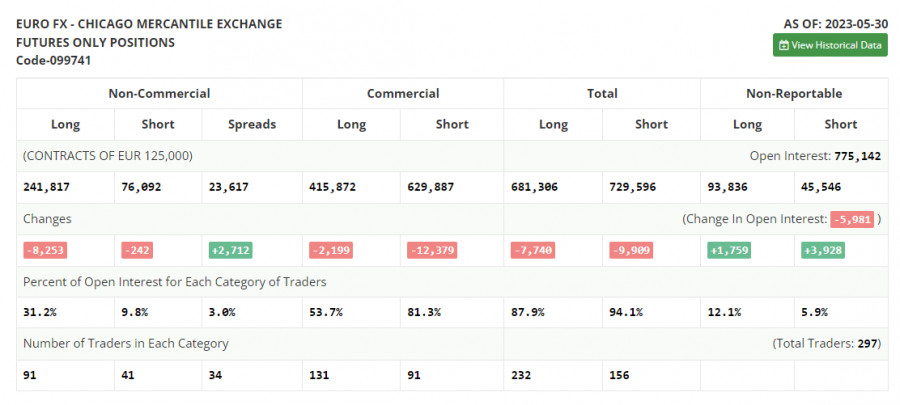
The Commitment of Traders (COT) report for May 30 indicated both long and short positions have declined. Long positions decreased significantly more, confirming lower demand for risky assets. Concerns about the European economic slowdown and the onset of a recession, coupled with the European Central Bank's continued aggressive policy despite the first signs of a slowdown amid underlying inflationary pressure, are currently discouraging investors from going long on the euro. This situation is forcing them to maintain a wait-and-see position. Meanwhile, the US labor market remains strong, and the Federal Reserve is likely to continue hiking interest rates after the June pause, thereby maintaining demand for the dollar. According to the COT report, non-commercial long positions decreased by 8,253 to 241,817, while non-commercial short positions fell by 242 to 76,092. The overall non-commercial net position decreased to 163,054 from 185,045 at the end of the week. The weekly closing price decreased to 1.0732 from 1.0793.
Indicator signals:
Moving Averages
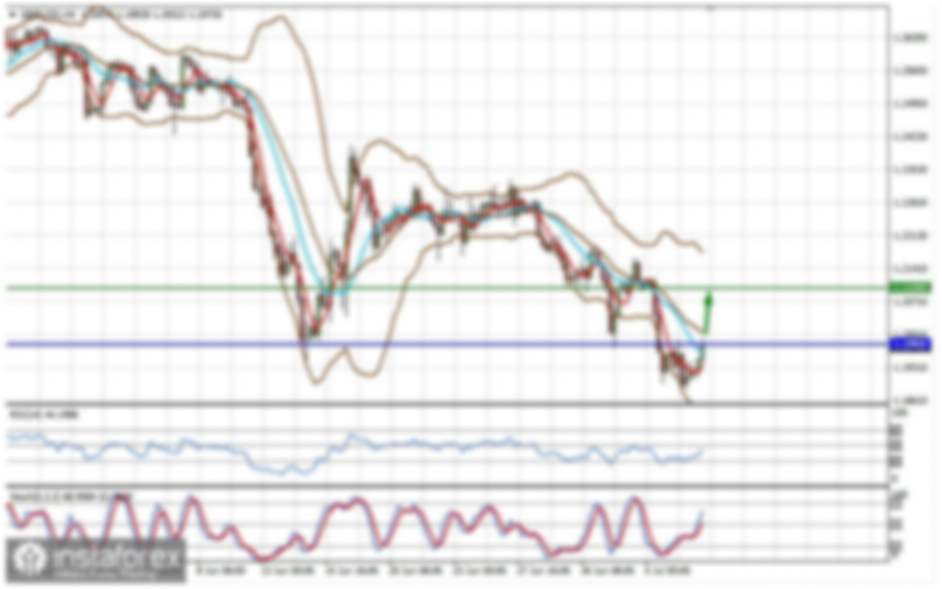
Trading is taking place above the 30- and 50-day moving averages, indicating that bullish traders are trying to extend the upward movement.
Note: The period and prices of moving averages are considered by the author on an hourly chart (H1) and differ from the general definition of classical daily moving averages on the daily chart (D1).
Bollinger Bands
If EUR/USD declines, the lower boundary of the indicator around 1.0740 will act as support.
Description of indicators
Moving average (moving average, determines the current trend by smoothing out volatility and noise). Period 50. It is marked yellow on the chart. Moving average (moving average, determines the current trend by smoothing out volatility and noise). Period 30. It is marked green on the chart. MACD indicator (Moving Average Convergence/Divergence - convergence/divergence of moving averages) Quick EMA period 12. Slow EMA period to 26. SMA period 9 Bollinger Bands (Bollinger Bands). Period 20 Non-commercial speculative traders, such as individual traders, hedge funds, and large institutions that use the futures market for speculative purposes and meet certain requirements. Long non-commercial positions represent the total long open position of non-commercial traders. Short non-commercial positions represent the total short open position of non-commercial traders. Total non-commercial net position is the difference between the short and long positions of non-commercial traders.