empty
18.06.2025 03:56 AM
Trading Recommendations and Analysis for EUR/USD on June 18: The Dollar Rises Paradoxically

EUR/USD 5-Minute Analysis

This image is no longer relevant

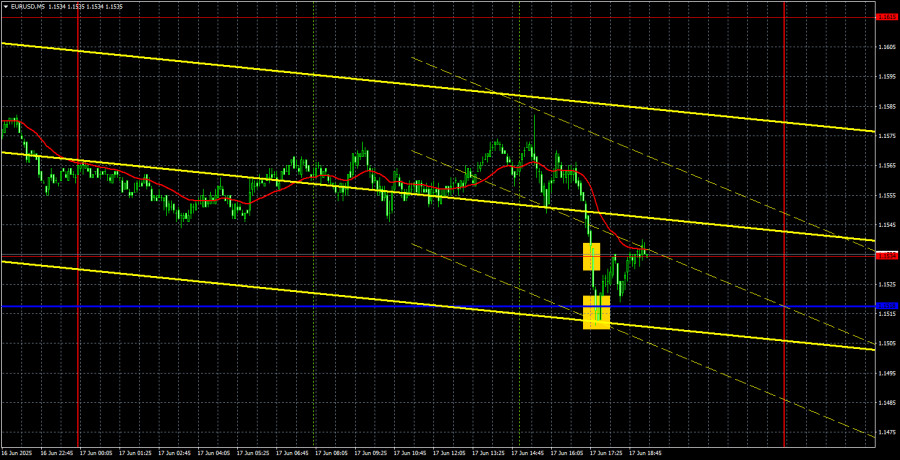
The EUR/USD currency pair unexpectedly rose during the U.S. trading session on Wednesday. The increase in the U.S. dollar was surprising, as there was no positive news to support it—quite the opposite. The two most significant macroeconomic reports for the day — U.S. retail sales and industrial production — came in weaker than forecast. Retail sales fell by 0.9% (vs. -0.7% expected), and industrial production dropped by 0.2% (vs. +0.1% forecast). Thus, the dollar had every reason to continue its five-month decline. Yet, something inexplicable happened.

Could Donald Trump have announced tariff reductions or cancellations? No. On the contrary, the U.S. president once again lashed out at the European Union for "still not offering him a fair trade deal." So, the decline of the EUR/USD pair was quite strange. From a technical perspective, the price broke below another trend line, and the Kijun-sen line was tested. If this line is breached, the dollar could continue rising toward the Senkou Span B line on technical grounds. Remember that the dollar is extremely oversold and cannot fall forever.

On the 5-minute timeframe, trading signals formed at the very end of the move. Unfortunately, the movement started from an area without clear levels or lines. By the end of the day, the pair was in the 1.1518–1.1534 zone. Depending on which boundary of this range the price breaks through, the dollar will either rise or fall on Wednesday. It's quite possible that what we saw yesterday was the market's early reaction to the upcoming Federal Reserve meeting.

EUR/USD 1D Analysis (ICT Methodology)

This image is no longer relevant

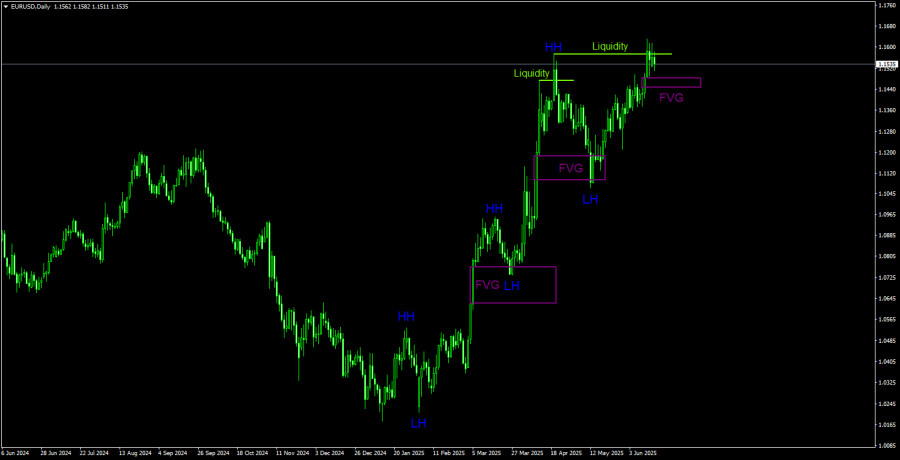
In the long term, we see a clear uptrend. Of course, this uptrend will end someday, but the only current signal for a potential drop is the liquidity grab from the last higher high (HH). On the bullish side, we have a bullish Fair Value Gap (FVG) zone. A bounce from this zone, confirmed on lower timeframes, would indicate the resumption of the euro's growth. The uptrend remains valid as long as the price stays above the 1.1100 level. This means the dollar could even strengthen by a few hundred points without changing the broader trend. Fundamentally, the backdrop continues to work against the U.S. dollar.

EUR/USD 1-Hour Analysis

This image is no longer relevant

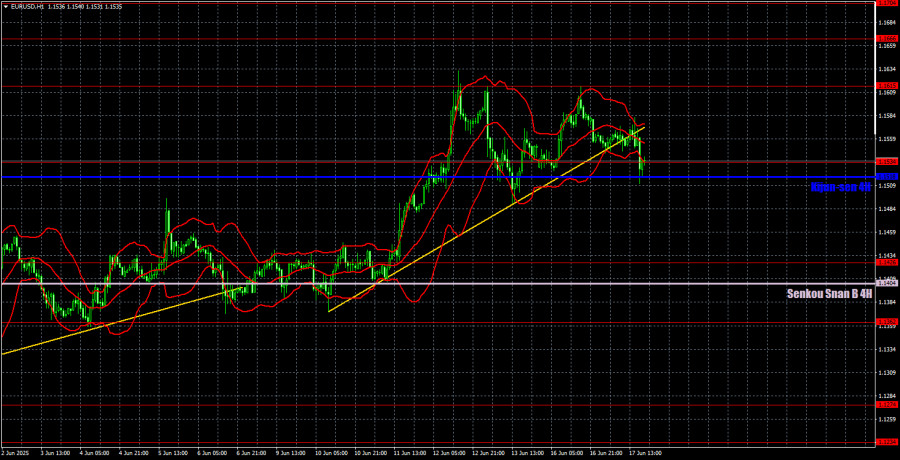
In the hourly timeframe, EUR/USD maintains a local uptrend despite breaking through and surpassing all known ascending trend lines. For instance, yesterday, the price failed to settle below the critical Kijun-sen line. As before (over the past five months), the market reacts mainly to events surrounding Trump, his decisions, and the trade war. The full-blown Middle East war has been added to this already "wonderful and positive" mix. Positive news is nonexistent, while there's no shortage of negative developments. Therefore, the dollar continues to depreciate, which greatly benefits Trump.

For June 18, we highlight the following trading levels: 1.1092, 1.1147, 1.1185, 1.1234, 1.1274, 1.1362, 1.1426, 1.1534, 1.1615, 1.1666, 1.1704, 1.1750. Also relevant are the Senkou Span B line (1.1404) and the Kijun-sen line (1.1518). Ichimoku lines may shift during the day, so this should be considered when identifying signals. Don't forget to set a Stop Loss to break even after a 15-pip move in the right direction — this helps protect against false signals.

There will only be minor reports from the EU and the U.S. throughout Wednesday. However, the Fed meeting results will be announced in the evening. We believe yesterday's dollar strength is tied specifically to that upcoming event—and nothing else. We do not expect the Fed to offer any support for the U.S. dollar, but it's better to wait for the official outcome before drawing conclusions. A break below the critical line would allow the pair to continue moving south.

Illustration Explanations:

  • Support and resistance price levels – thick red lines where movement may end. They are not trading signal sources.
  • Kijun-sen and Senkou Span B lines—These are strong Ichimoku indicator lines transferred to the hourly timeframe from the 4-hour one.
  • Extremum levels – thin red lines where the price has previously rebounded. These act as trading signal sources.
  • Yellow lines – trend lines, trend channels, and other technical patterns.
  • COT Indicator 1 on the charts – the size of the net position for each category of traders.
Summary
Urgency
Analytic
Stanislav Polyanskiy
Start trade
Gana con los cambios en el valor de las criptomonedas con InstaForex.
Descarga MetaTrader 4 y abre tu primera operación.
  • Grand Choice
    Contest by
    InstaForex
    InstaForex always strives to help you
    fulfill your biggest dreams.
    UNIRSE AL CONCURSO

Recommended Stories

Recomendaciones para operar y análisis de las operaciones con el par GBP/USD el 24 de julio. La libra no encontró razones para hacer una pausa.

Análisis del par GBP/USD 5M. El par de divisas GBP/USD durante el miércoles, a diferencia del par EUR/USD, continuó tranquilamente su movimiento hacia el Norte. Durante el día no hubo

Paolo Greco 07:22 2025-07-24 UTC+2

Recomendaciones para operar y análisis de las operaciones con el par EUR/USD el 24 de julio. Los acuerdos comerciales de Trump no ayudaron al dólar.

Análisis del par EUR/USD 5M. El par de divisas EUR/USD durante el miércoles no mostró ningún movimiento interesante, y el mercado no mostró ningún interés en los acuerdos comerciales

Paolo Greco 07:21 2025-07-24 UTC+2

GBP/USD: plan para la sesión europea del 23 de julio. Informes COT (análisis de las operaciones de ayer). La libra actualizó el máximo semanal

Ayer se formaron varios puntos de entrada al mercado. Vamos a ver el gráfico de 5 minutos y entender qué ocurrió. En mi pronóstico de la mañana presté atención

Miroslaw Bawulski 08:47 2025-07-23 UTC+2

EUR/USD: plan para la sesión europea del 23 de julio. Informes COT (análisis de las operaciones de ayer). El euro creció bastante bien

Ayer se formaron varios puntos de entrada al mercado. Vamos a ver el gráfico de 5 minutos y entender qué pasó allí. En mi pronóstico de la mañana presté atención

Miroslaw Bawulski 08:47 2025-07-23 UTC+2

Recomendaciones para operar y análisis de las operaciones con el par GBP/USD el 23 de julio. El crecimiento lógico continúa.

El par de divisas GBP/USD también continúa su movimiento ascendente durante el martes. La nueva caída de la moneda estadounidense puede intentarse vincular con el discurso de Jerome Powell, como

Paolo Greco 07:54 2025-07-23 UTC+2

Recomendaciones para operar y análisis de las operaciones con el par EUR/USD el 23 de julio. La caída predecible del dólar continúa.

El par de divisas EUR/USD durante el martes permaneció inmóvil durante la primera mitad del día y en la segunda mitad se negoció al alza. En la segunda mitad

Paolo Greco 07:54 2025-07-23 UTC+2

EUR/USD: plan para la sesión europea del 22 de julio. Informes COT (análisis de las operaciones de ayer). Los compradores del euro se activaron

Ayer se formaron varios puntos de entrada al mercado. Vamos a mirar el gráfico de 5 minutos y analizar lo que ocurrió. En mi pronóstico de la mañana presté atención

Miroslaw Bawulski 07:51 2025-07-22 UTC+2

Cómo operar el par GBP/USD el 22 de julio. Consejos simples y análisis de operaciones para principiantes.

El par GBP/USD mostró el lunes exactamente los mismos movimientos que el par EUR/USD. Por lo tanto, es evidente que en todo el mercado el dólar estadounidense comenzó una nueva

Paolo Greco 07:51 2025-07-22 UTC+2

Cómo operar el par EUR/USD el 22 de julio. Consejos simples y análisis de operaciones para principiantes.

El par de divisas EUR/USD aparentemente completó el lunes una tendencia bajista de tres semanas. Recordemos que durante al menos las últimas dos semanas, desde Estados Unidos llegaba una gran

Paolo Greco 07:51 2025-07-22 UTC+2

EUR/USD: plan para la sesión europea del 21 de julio. Informes COT (análisis de las operaciones de ayer). La corrección del euro se acerca a su final

El viernes pasado se formó solo un punto de entrada al mercado. Veamos el gráfico de 5 minutos y analicemos lo que ocurrió. En mi pronóstico de la mañana, presté

Miroslaw Bawulski 08:11 2025-07-21 UTC+2
¿No puede hablar ahora mismo?
Ingrese su pregunta en el chat.
Widget callback
 

Dear visitor,

Your IP address shows that you are currently located in the USA. If you are a resident of the United States, you are prohibited from using the services of InstaFintech Group including online trading, online transfers, deposit/withdrawal of funds, etc.

If you think you are seeing this message by mistake and your location is not the US, kindly proceed to the website. Otherwise, you must leave the website in order to comply with government restrictions.

Why does your IP address show your location as the USA?

  • - you are using a VPN provided by a hosting company based in the United States;
  • - your IP does not have proper WHOIS records;
  • - an error occurred in the WHOIS geolocation database.

Please confirm whether you are a US resident or not by clicking the relevant button below. If you choose the wrong option, being a US resident, you will not be able to open an account with InstaForex anyway.

We are sorry for any inconvenience caused by this message.