empty
30.06.2025 09:08 AM
USD/JPY: Simple Trading Tips for Beginner Traders on June 30. Analysis of Yesterday's Forex Trades

Analysis of Trades and Trading Tips for the Japanese Yen

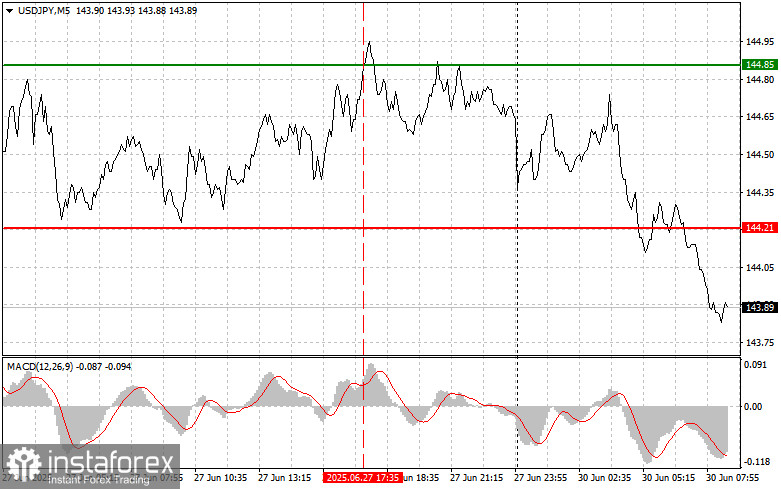
The test of the 144.85 price level occurred at a time when the MACD indicator had already moved significantly above the zero line, which limited the dollar's upside potential. For this reason, I did not buy the dollar.

As last Friday's data showed, the U.S. Core Personal Consumption Expenditures (PCE) index for May came in only slightly above economists' forecasts, which did not provide significant support for the dollar and allowed the Japanese yen to strengthen. The slowdown in inflation, as reflected in the personal income and expenditure report, reinforced expectations that the Federal Reserve might soon shift its monetary policy toward easing. These expectations added pressure on the dollar and supported the yen, which is traditionally considered a safe-haven asset during times of economic uncertainty.

Today's weak data on changes in industrial production and housing starts in Japan put additional pressure on the yen. A decline in industrial output signals a slowdown in economic activity in a key sector, while a drop in housing starts indicates reduced investment activity and weakening confidence in the outlook for the real estate market. These figures, released amid ongoing global economic uncertainty, raised concerns among investors about the resilience of the Japanese economy. The impact of these factors on the yen is compounded by the Bank of Japan's policy, which continues to pursue interest rate hikes.

For intraday strategy, I will focus primarily on implementing Scenarios #1 and #2.
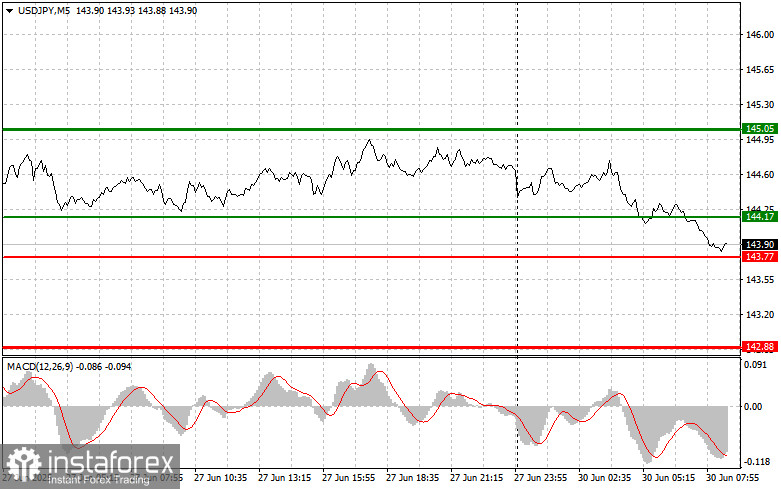
This image is no longer relevant

Buy Scenario

Scenario #1: I plan to buy USD/JPY today upon reaching the entry point around 144.17 (green line on the chart), targeting a rise toward 145.05 (thicker green line on the chart). Around 145.05, I intend to exit long positions and open short ones in the opposite direction (aiming for a 30–35 point move down from that level). It is best to buy the pair on corrections and substantial pullbacks in USD/JPY.

Important! Before buying, ensure the MACD indicator is above the zero line and is just starting to rise from it.

Scenario #2: I also plan to buy USD/JPY today in the event of two consecutive tests of the 143.77 level while the MACD indicator is in the oversold zone. This will limit the pair's downside potential and lead to a market reversal upward. A rise toward the opposite levels of 144.17 and 145.05 can be expected.

Sell Scenario

Scenario #1: I plan to sell USD/JPY today only after the 143.77 level is updated (indicated by the red line on the chart), which should lead to a rapid decline in the pair. The key target for sellers will be the 142.88 level, where I plan to exit short positions and immediately open long positions in the opposite direction (aiming for a 20–25 point move up from that level). Selling pressure on the pair may return quickly today.

Important! Before selling, ensure the MACD indicator is below the zero line and is just starting to decline from it.

Scenario #2: I also plan to sell USD/JPY today in the event of two consecutive tests of the 144.17 level while the MACD indicator is in the overbought zone. This will limit the pair's upside potential and lead to a downward market reversal. A drop toward the opposite levels of 143.77 and 142.88 can be expected.

This image is no longer relevant

What's on the Chart:

  • The thin green line represents the entry price where the trading instrument can be bought.
  • The thick green line indicates the expected price level where a Take Profit order can be placed, or profits can be manually secured, as further price growth above this level is unlikely.
  • The thin red line represents the entry price where the trading instrument can be sold.
  • The thick red line indicates the expected price level where a Take Profit order can be placed, or profits can be manually secured, as further price decline below this level is unlikely.
  • The MACD indicator should be used to assess overbought and oversold zones when entering the market.

Important Notes:

  • Beginner Forex traders should exercise extreme caution when making market entry decisions. It is advisable to stay out of the market before the release of important fundamental reports to avoid exposure to sharp price fluctuations. If you choose to trade during news releases, always use stop-loss orders to minimize potential losses. Trading without stop-loss orders can quickly wipe out your entire deposit, especially if you neglect money management principles and trade with high volumes.
  • Remember, successful trading requires a well-defined trading plan, similar to the one outlined above. Making impulsive trading decisions based on the current market situation is a losing strategy for intraday traders.
Summary
Urgency
Analytic
Pavel Vlasov
Start trade
Gana con los cambios en el valor de las criptomonedas con InstaForex.
Descarga MetaTrader 4 y abre tu primera operación.
  • Grand Choice
    Contest by
    InstaForex
    InstaForex always strives to help you
    fulfill your biggest dreams.
    UNIRSE AL CONCURSO

Recommended Stories

Petróleo. Compresión hacia la resistencia y exportación forzada de petróleo desde Irán: señales preocupantes

Los futuros del petróleo Brent se acercaron a la zona de resistencia descendente, pero no lograron consolidarse por encima, retrocediendo hacia abajo. El panorama técnico sigue siendo tenso: el precio

Anna Zotova 13:20 2025-06-20 UTC+2

OPEP+ golpea al esquisto, el Brent pierde apoyo

Los futuros del crudo Brent vuelven a estar bajo presión: el precio no logró mantenerse por encima de la zona clave de $65,5 por barril y entró en una fase

Anna Zotova 14:04 2025-05-22 UTC+2

El Gas en un triángulo, el petróleo listo para saltar. La geopolítica vuelve a dictar las reglas del juego

El petróleo respira cambios. La política y la economía vuelven a entrelazarse en un nudo apretado, y los activos de materias primas —especialmente el petróleo y el gas— se convierten

Anna Zotova 11:21 2025-03-25 UTC+2

¿Crecimiento falso o nueva tendencia? Análisis de señales técnicas y fundamentales para el petróleo y el gas

Los futuros del petróleo Brent subieron a aproximadamente $71,3 por barril el martes, marcando la tercera sesión consecutiva de crecimiento, ya que la tensión en Medio Oriente eclipsó otros acontecimientos

Anna Zotova 10:58 2025-03-18 UTC+2

El S&P 500 asalta la cima. Informes sólidos y desregulación como detonantes del optimismo del mercado

El mercado bursátil vuelve a subir, con el S&P 500 en la cúspide de la euforia. ¿Qué será lo próximo? ¿Los aranceles y la política de la Reserva Federal reforzarán

Anna Zotova 10:18 2025-01-24 UTC+2

El S&P 500 está en la cima de la ola. Han aparecido síntomas de un mercado bajista

El jueves, los futuros de las acciones estadounidenses permanecen prácticamente sin cambios después de un impresionante rally en la sesión de trading anterior, cuando el S&P 500 alcanzó máximos históricos

Anna Zotova 09:58 2025-01-23 UTC+2

S&P 500. Sesgo alcista. El mercado sube con la vista puesta en Trump

Los futuros de las acciones estadounidenses registran ganancias el miércoles, tras el sólido repunte de la víspera. El martes, el índice S&P 500 subió un 0,88% y el Nasdaq sumó

Anna Zotova 10:28 2025-01-22 UTC+2

Petróleo y gas. Perspectivas para la semana

El petróleo Brent muestra un descenso, pero sigue negociándose por encima de los $80 por barril. No se descarta un fortalecimiento de la corrección hasta el rango de los $77,5-78,0

Anna Zotova 11:06 2025-01-20 UTC+2

USD/JPY: consejos simples para operar para traders principiantes el 17 de enero. Análisis de las operaciones de ayer en forex.

Análisis de operaciones y consejos para operar con el yen japonés La prueba del precio 155.96 coincidió con el momento en que el indicador MACD apenas comenzaba a moverse hacia

Jakub Novak 07:29 2025-01-17 UTC+2

GBP/USD: consejos simples para operar para traders principiantes el 17 de enero. Análisis de las operaciones de ayer en forex.

Análisis de operaciones y consejos para operar con la libra esterlina. La primera prueba del precio 1.2184 en la segunda mitad del día coincidió con el momento

Jakub Novak 07:29 2025-01-17 UTC+2
¿No puede hablar ahora mismo?
Ingrese su pregunta en el chat.
Widget callback
 

Dear visitor,

Your IP address shows that you are currently located in the USA. If you are a resident of the United States, you are prohibited from using the services of InstaFintech Group including online trading, online transfers, deposit/withdrawal of funds, etc.

If you think you are seeing this message by mistake and your location is not the US, kindly proceed to the website. Otherwise, you must leave the website in order to comply with government restrictions.

Why does your IP address show your location as the USA?

  • - you are using a VPN provided by a hosting company based in the United States;
  • - your IP does not have proper WHOIS records;
  • - an error occurred in the WHOIS geolocation database.

Please confirm whether you are a US resident or not by clicking the relevant button below. If you choose the wrong option, being a US resident, you will not be able to open an account with InstaForex anyway.

We are sorry for any inconvenience caused by this message.