empty
04.07.2025 03:56 AM
Trading Recommendations and Analysis for EUR/USD on July 4: U.S. Independence Day

EUR/USD 5-Minute Analysis

This image is no longer relevant

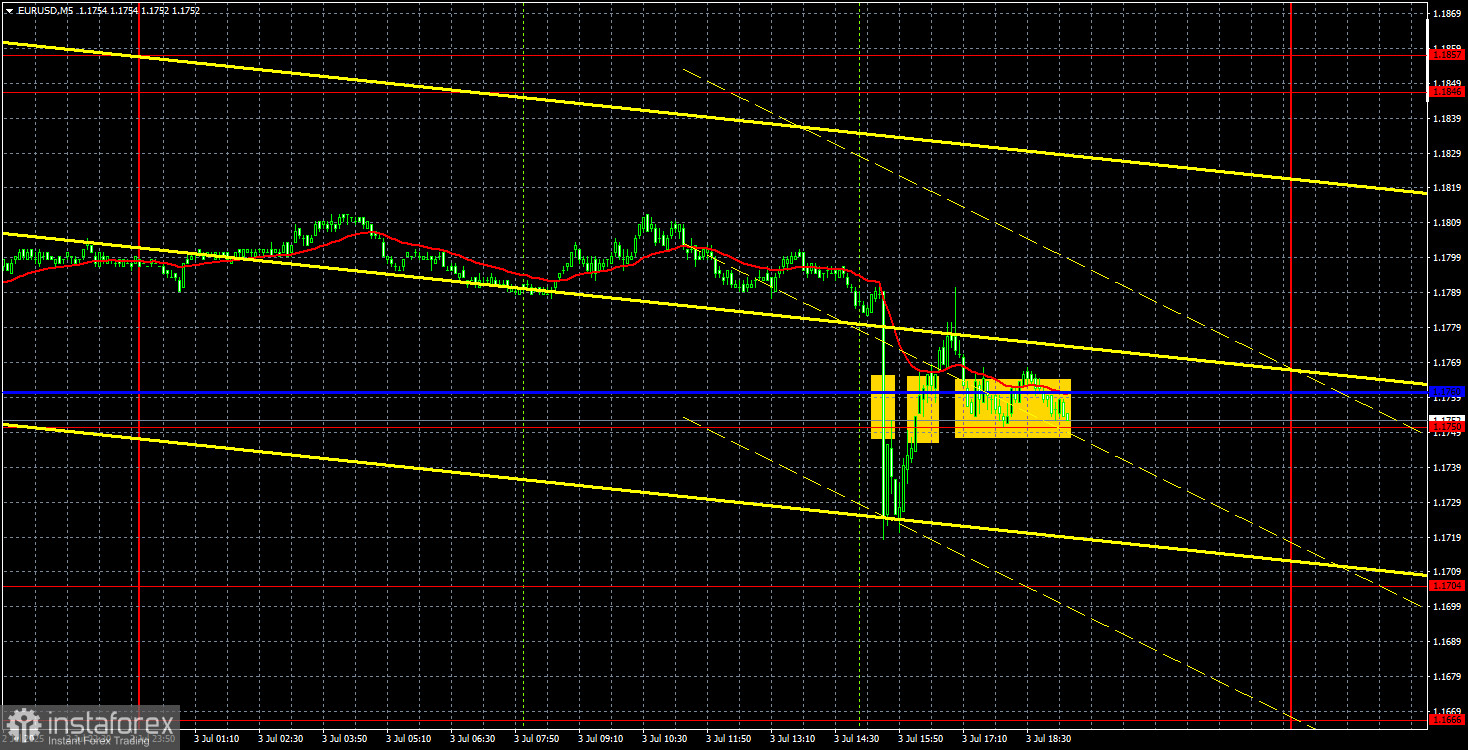
The EUR/USD currency pair traded quite expressively on Thursday. For most of the day, we observed a low-volatility sideways movement, and as soon as U.S. labor market and unemployment data were released, the price plummeted. And the drop was not without reason, as the two most important reports of the week came out stronger than forecast. The unemployment rate, against logic and common sense, decreased in June, and the number of NonFarm Payrolls significantly exceeded expectations.

However, the most important aspect wasn't the unemployment or labor market data. The key factor was the traders' reaction. The market instantly dropped by 70 pips (in literally 5 minutes) and then nearly fully recovered within an hour. That was all the strengthening the U.S. dollar managed to achieve. Moreover, while macroeconomic data from overseas were encouraging this week, macro data is no longer the deciding factor for the dollar's fate. We've already mentioned that the deals signed by Donald Trump — and their overall number — can only evoke laughter among traders. Out of 75 countries, only the UK, Vietnam, and China signed agreements with Washington. And even the deal with China raises numerous questions.

Thus, we believe the general fundamental background, which has dragged the dollar into the abyss for 5 months, remains completely unchanged. The strength of the U.S. labor market merely means that the Federal Reserve may leave the key rate unchanged in the near term. But what does the rate even matter to the dollar if it's been falling throughout 2025, while the Fed holds it at 4.5% and the Bank of England and European Central Bank are cutting theirs?

On the 5-minute chart, trading signals only formed after the release of U.S. data. The sell signal in the 1.1750–1.1760 range was hardly worth acting on, for obvious reasons. However, long positions on the opposing signal could have been considered. Still, the price couldn't sustain either a rally or a drop.

COT Report

This image is no longer relevant

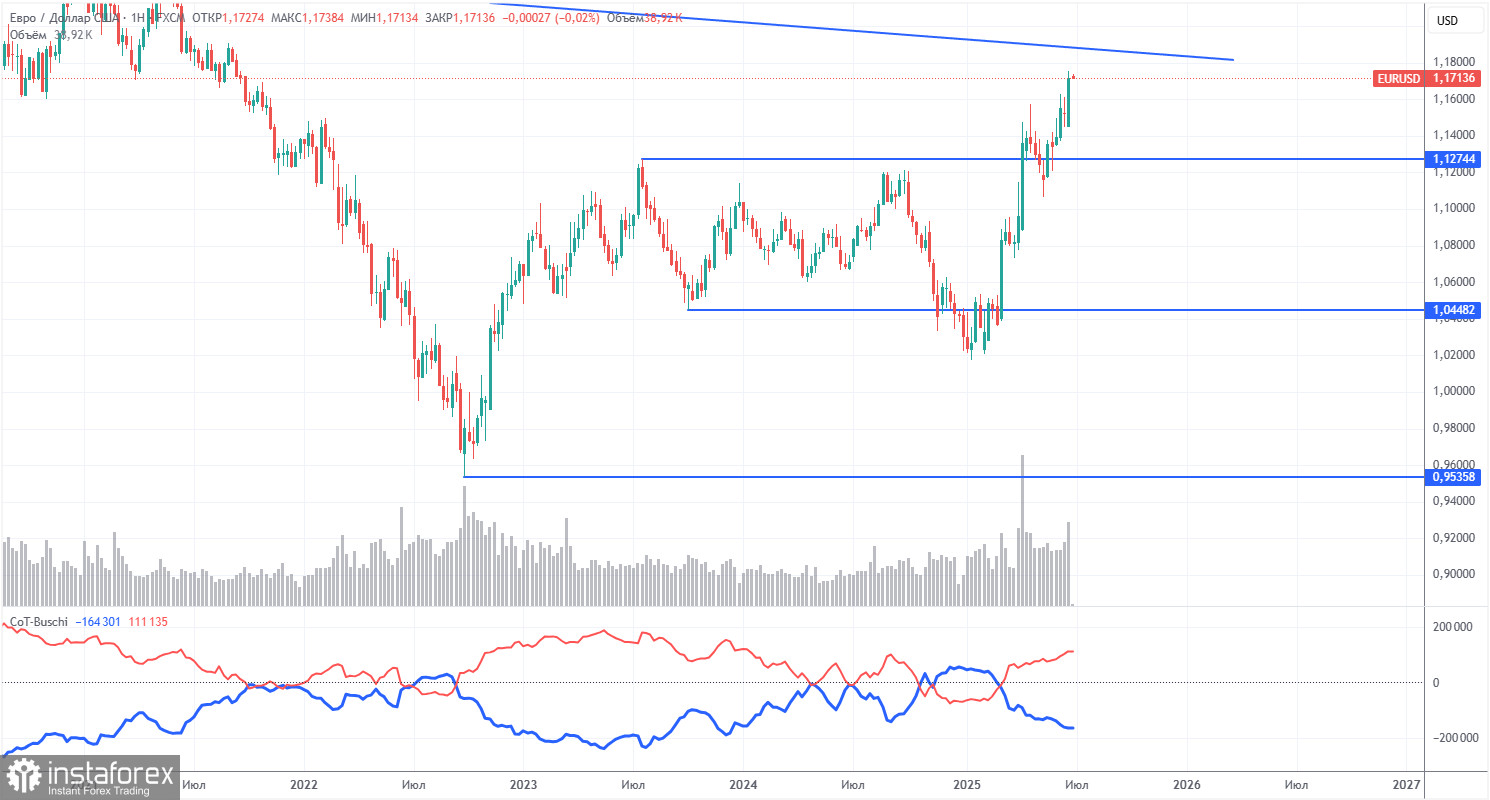
The latest COT report is dated June 24. As clearly shown in the illustration above, the net position of non-commercial traders had been "bullish" for a long time. Bears barely gained the upper hand by the end of 2024 but quickly lost that advantage. Since Trump assumed the presidency, only the dollar has been falling. We cannot say with 100% certainty that the decline will continue, but current global developments suggest that it may very well do so.

We still see no fundamental reasons for the euro to strengthen — but there is one strong reason for the dollar to fall. The global downtrend remains in place. But at this point, does it matter where the price moved over the past 16 years? Once Trump ends his trade wars, the dollar might begin to recover — but will Trump ever end them? And when?

Currently, the red and blue lines have crossed again, which means the market trend has once again turned bullish. During the last reporting week, the number of long positions in the non-commercial group increased by 3,000 contracts, while the number of short positions decreased by 6,600. As a result, the net position increased by 9,600 contracts over the week.

EUR/USD 1-Hour Analysis

This image is no longer relevant

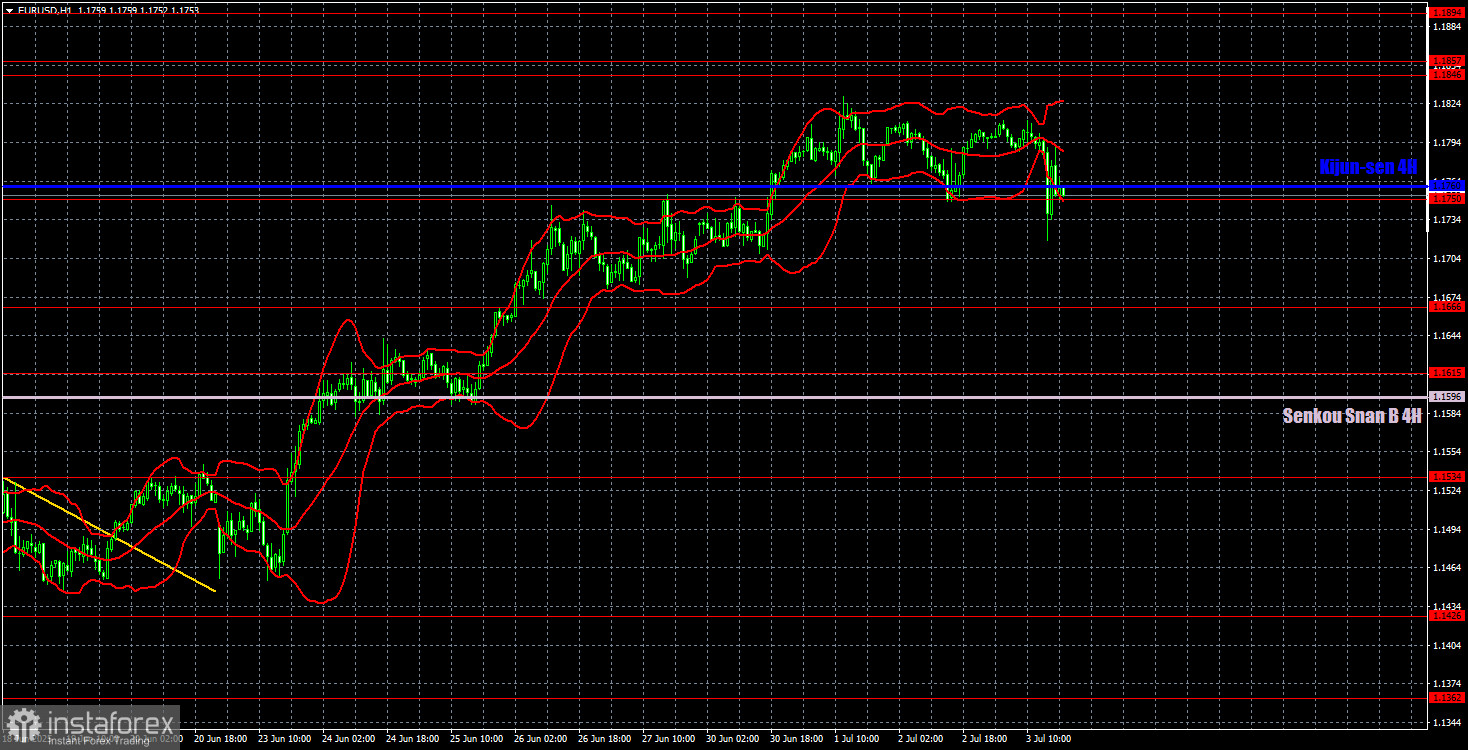
On the hourly timeframe, EUR/USD continues to form an upward trend, and the movement is nearly uninterrupted, visible on almost any chart above 1H. The U.S. continues to pour out news that forces traders to abandon the dollar. This news relates to the economy, politics, migration, and social support. The market is actively reacting to all of it. This week, the dollar received slight support from macroeconomic data, but it didn't significantly impact the bigger picture.

For July 4, we highlight the following trading levels: 1.1092, 1.1147, 1.1185, 1.1234, 1.1274, 1.1362, 1.1426, 1.1534, 1.1615, 1.1666, 1.1750, 1.1846–1.1857, as well as the Senkou Span B line (1.1596) and Kijun-sen line (1.1760). Ichimoku indicator lines may shift throughout the day, so take that into account when determining trading signals. Don't forget to place the Stop Loss to breakeven if the price moves 15 pips in the correct direction — this will protect you from possible losses in case of false signals.

On Friday, the U.S. will observe Independence Day, so trading in the second half of the day will likely be minimal. In the first half, traders will also have little to react to. ECB President Christine Lagarde will speak publicly again, but there have already been 5 or 6 such appearances in the past two weeks.

Illustration Explanations:

  • Support and resistance price levels – thick red lines where movement may end. They are not trading signal sources.
  • Kijun-sen and Senkou Span B lines—These are strong Ichimoku indicator lines transferred to the hourly timeframe from the 4-hour one.
  • Extremum levels – thin red lines where the price has previously rebounded. These act as trading signal sources.
  • Yellow lines – trend lines, trend channels, and other technical patterns.
  • COT Indicator 1 on the charts – the size of the net position for each category of traders.
Summary
Urgency
Analytic
Stanislav Polyanskiy
Start trade
Gana con los cambios en el valor de las criptomonedas con InstaForex.
Descarga MetaTrader 4 y abre tu primera operación.
  • Grand Choice
    Contest by
    InstaForex
    InstaForex always strives to help you
    fulfill your biggest dreams.
    UNIRSE AL CONCURSO

Recommended Stories

Idea de negociación del oro a la baja

Después de una fuerte iniciativa bajista de dos días, el instrumento pasó a una corrección alcista y en este momento está testeando la zona de ruptura bajista, desde la cual

Andrey Shevchenko 11:36 2025-07-18 UTC+2

GBP/USD plan para la sesión europea del 18 de julio. Informes Commitment of Traders COT (análisis de las operaciones de ayer). La libra esterlina se recuperó ligeramente

Ayer se formó solo un punto de entrada al mercado. Veamos el gráfico de 5 minutos y analicemos lo que ocurrió. En mi pronóstico de la mañana, presté atención

Miroslaw Bawulski 07:50 2025-07-18 UTC+2

EUR/USD plan para la sesión europea del 18 de julio. Informes Commitment of Traders COT (análisis de las operaciones de ayer). El euro rebotó desde el mínimo semanal

Ayer se formó solo un punto de entrada al mercado. Veamos el gráfico de 5 minutos y analicemos lo que ocurrió. En mi pronóstico de la mañana, presté atención

Miroslaw Bawulski 07:50 2025-07-18 UTC+2

Cómo operar el par GBP/USD el 18 de julio. Consejos simples y análisis de operaciones para principiantes.

Análisis de operaciones del jueves: El par GBP/USD el jueves también se negoció con una volatilidad mínima. Por extraño que parezca, ayer hubo bastantes datos interesantes tanto para la libra

Paolo Greco 07:50 2025-07-18 UTC+2

Cómo operar el par EUR/USD el 18 de julio. Consejos simples y análisis de operaciones para principiantes.

El par EUR/USD el jueves se negoció prácticamente en flat y con una volatilidad muy baja (alrededor de 50 puntos). Después de la tormenta del miércoles por la noche, provocada

Paolo Greco 07:50 2025-07-18 UTC+2

GBP/USD plan para la sesión europea del 17 de julio. Informes Commitment of Traders COT (análisis de las operaciones de ayer). La libra esterlina tuvo mucha suerte

Ayer se formaron varios puntos de entrada al mercado. Veamos el gráfico de 5 minutos y analicemos lo que ocurrió. En mi pronóstico matutino presté atención al nivel 1.3376

Miroslaw Bawulski 07:19 2025-07-17 UTC+2

EUR/USD plan para la sesión europea del 17 de julio. Informes Commitment of Traders COT (análisis de las operaciones de ayer). La presión sobre el jefe de la Fed de EE. UU. afecta negativamente al dólar

EUR/USD plan para la sesión europea del 17 de julio. Informes Commitment of Traders COT (análisis de las operaciones de ayer). La presión sobre el jefe

Miroslaw Bawulski 07:19 2025-07-17 UTC+2

Cómo operar con el par EUR/USD el 16 de julio. Consejos simples y análisis de operaciones para principiantes.

El par de divisas EUR/USD se desplomó bruscamente el martes en medio del informe sobre la inflación estadounidense. Como se suele decir, nada presagiaba el problema. Durante varios días consecutivos

Paolo Greco 07:54 2025-07-16 UTC+2

GBP/USD plan para la sesión europea del 16 de julio. Informes Commitment of Traders COT (análisis de las operaciones de ayer). Con la libra esterlina todo va mal

Ayer solo se formó un punto de entrada al mercado. Veamos el gráfico de 5 minutos y analicemos qué ocurrió. En mi pronóstico de la mañana presté atención al nivel

Miroslaw Bawulski 07:54 2025-07-16 UTC+2

EUR/USD plan para la sesión europea del 15 de julio. Informes Commitment of Traders COT (análisis de las operaciones de ayer). La inflación en EE.UU. aumentó

Ayer no llegué a ver condiciones adecuadas para entrar al mercado. Veamos el gráfico de 5 minutos y analicemos lo que ocurrió. En mi pronóstico de la mañana, presté atención

Miroslaw Bawulski 07:54 2025-07-16 UTC+2
¿No puede hablar ahora mismo?
Ingrese su pregunta en el chat.
Widget callback
 

Dear visitor,

Your IP address shows that you are currently located in the USA. If you are a resident of the United States, you are prohibited from using the services of InstaFintech Group including online trading, online transfers, deposit/withdrawal of funds, etc.

If you think you are seeing this message by mistake and your location is not the US, kindly proceed to the website. Otherwise, you must leave the website in order to comply with government restrictions.

Why does your IP address show your location as the USA?

  • - you are using a VPN provided by a hosting company based in the United States;
  • - your IP does not have proper WHOIS records;
  • - an error occurred in the WHOIS geolocation database.

Please confirm whether you are a US resident or not by clicking the relevant button below. If you choose the wrong option, being a US resident, you will not be able to open an account with InstaForex anyway.

We are sorry for any inconvenience caused by this message.