The EUR/USD currency pair traded rather listlessly on Wednesday, and the current week feels as though there has been absolutely no news. There are indeed very few macroeconomic reports, as hardly anyone was truly interested in the weekly ADP report or the consumer confidence index in Germany. Essentially, we only saw movement in the first hours of the current week, when the market reacted to Trump's new tariffs and their immediate increase to 15%. Then followed a pullback and then lackluster movements that can't even be called a flat market. Volatility has once again decreased to minimal levels, indicating the market's unwillingness to trade at this time.
What could this unwillingness be associated with? It can be anything and nothing at the same time. Remember the seven-month flat in the second half of last year! Was there really no significant news, events, and changes for seven months? On the contrary, Donald Trump was consistently imposing new tariffs, raising old ones, and then lowering them. The Fed simultaneously conducted three monetary policy easing measures, and the start of 2026 was marked by military operations in Venezuela, Trump's attempted military seizure of Greenland, new tariffs, U.S. Supreme Court decisions, and verbal attacks on Canada and South Korea. And we haven't even recalled the two "shutdowns," the criminal prosecution of Jerome Powell and Lisa Cook, and Trump's constant criticism of the Fed and the rest of the world. As we can see, there have been plenty of important events, but the EUR/USD pair spent seven months in a flat, as clearly visible on the daily timeframe.
Thus, no specific reasons are needed to begin a new flat. Recall that a flat is a period during which large players form new positions or redistribute old ones. It can start at any moment.
Regarding the prospects for the EUR/USD pair, we still believe it will continue its long-term upward trajectory, as observed on the daily timeframe for a year and on the weekly timeframe for four years. Trump won't let the dollar rise, though he doesn't do so intentionally or deliberately. The contradictory and inconsistent policies of the White House remain a key reason for the woes of the American currency.
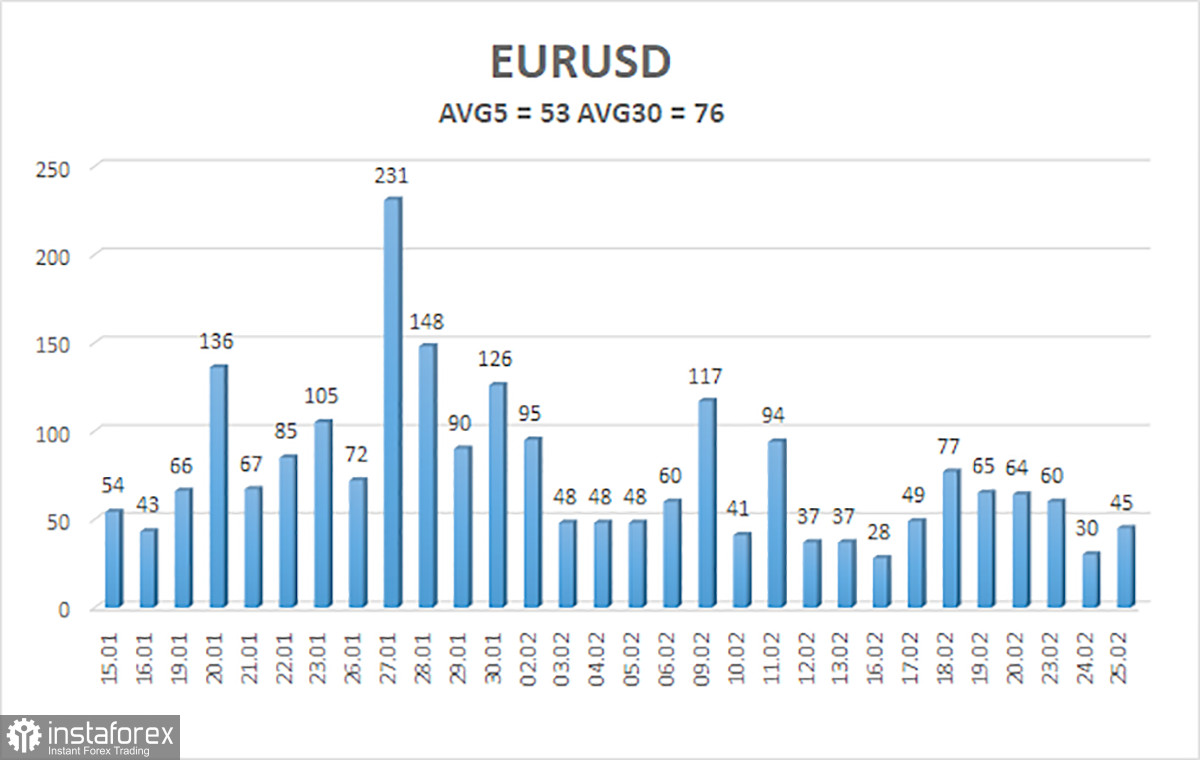
Even the latest macroeconomic data from the U.S. show that the economy is not on a stable footing. It is being tossed about from side to side. GDP was at 4.4% in the third quarter and fell to 1.4% in the fourth quarter. The labor market seemed to begin a recovery in January, but the data for 2025 are effectively negligible. The consumer price index is declining (which seemingly opens the door for the Fed to lower the key rate), but at the same time, Fed officials point to a lack of confidence in maintaining the upward momentum toward the target level. Uncertainty is the most fitting word to describe what is happening in the U.S. As a result, traders observe that, out of 16 trading days, only 3 had volatility above 65 pips.
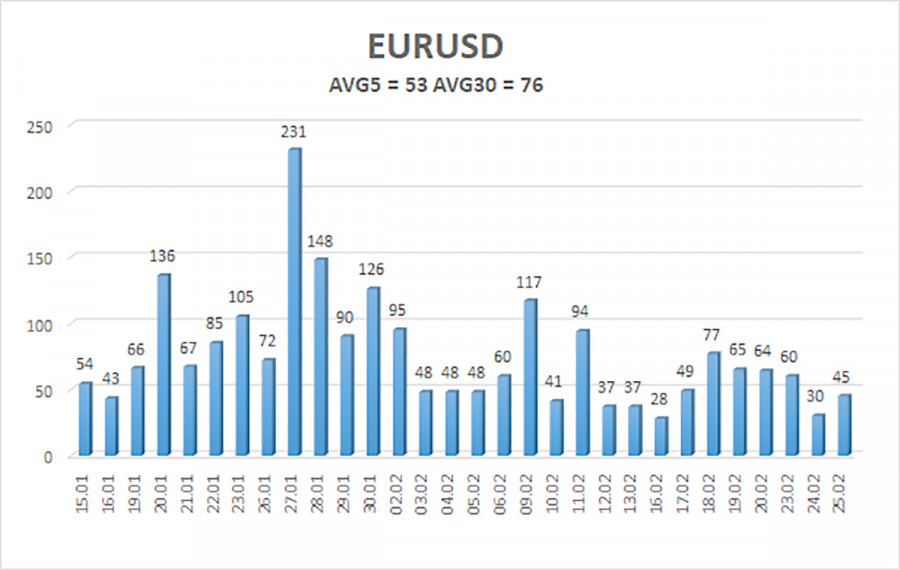
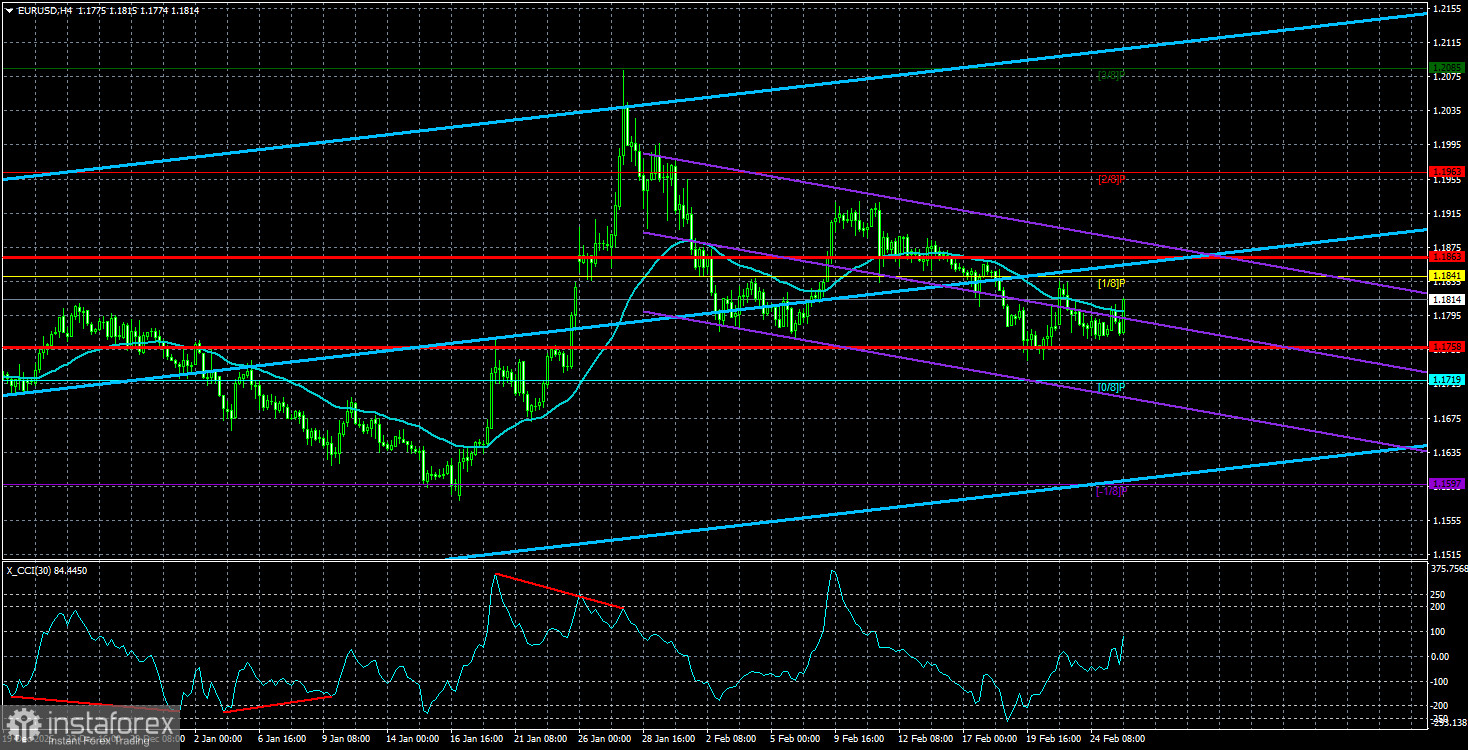
The average volatility of the EUR/USD currency pair over the last 5 trading days as of February 26 is 53 pips, which is considered "average." We expect the pair to trade between 1.1758 and 1.1863 on Thursday. The upper channel of the linear regression is pointing upwards, indicating further euro growth. The CCI indicator has entered oversold territory, signaling a potential resumption of the upward trend.
Nearest Support Levels:
- S1 – 1.1719
- S2 – 1.1597
- S3 – 1.1475
Nearest Resistance Levels:
- R1 – 1.1841
- R2 – 1.1963
- R3 – 1.2085
Trading Recommendations:
The EUR/USD pair continues to correct within the upward trend. The global fundamental background remains extremely negative for the dollar. The pair spent seven months in a sideways channel, and it is likely that now is the time to resume the global trend of 2025. The dollar has no fundamental basis for long-term growth. Therefore, all the dollar can hope for is a sideways move or corrections. When the price is below the moving average, one may consider small shorts with targets at 1.1758 and 1.1719 on purely technical grounds. Above the moving average line, long positions remain relevant with targets at 1.1963 and 1.2085.
Explanations for Illustrations:
- Linear regression channels help determine the current trend. If both are directed in the same way, then the trend is currently strong.
- The moving average line (settings 20,0, smoothed) determines the short-term trend and direction in which trading should currently be conducted.
- Murray levels are target levels for movements and corrections.
- Volatility levels (red lines) indicate the likely price channel within which the pair will trade over the next day based on current volatility indicators.
- The CCI indicator entering the oversold area (below -250) or the overbought area (above +250) signifies that a trend reversal in the opposite direction is approaching.