signal strength 1 of 5

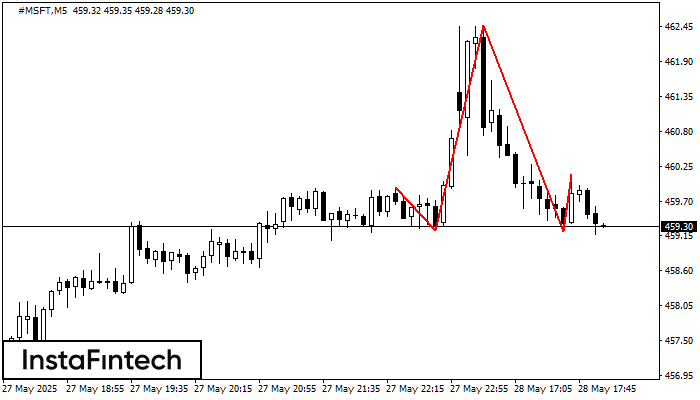
The #MSFT M5 formed the Head and Shoulders pattern with the following features: The Head’s top is at 462.46, the Neckline and the upward angle are at 459.23/459.22. The formation of this pattern can bring about changes in the current trend from bullish to bearish. In case the pattern triggers the expected changes, the price of #MSFT will go towards 459.07.
The M5 and M15 time frames may have more false entry points.
Xem thêm
- All
- Double Top
- Flag
- Head and Shoulders
- Pennant
- Rectangle
- Triangle
- Triple top
- All
- #AAPL
- #AMZN
- #Bitcoin
- #EBAY
- #FB
- #GOOG
- #INTC
- #KO
- #MA
- #MCD
- #MSFT
- #NTDOY
- #PEP
- #TSLA
- #TWTR
- AUDCAD
- AUDCHF
- AUDJPY
- AUDUSD
- EURCAD
- EURCHF
- EURGBP
- EURJPY
- EURNZD
- EURRUB
- EURUSD
- GBPAUD
- GBPCHF
- GBPJPY
- GBPUSD
- GOLD
- NZDCAD
- NZDCHF
- NZDJPY
- NZDUSD
- SILVER
- USDCAD
- USDCHF
- USDJPY
- USDRUB
- All
- M5
- M15
- M30
- H1
- D1
- All
- Buy
- Sale
- All
- 1
- 2
- 3
- 4
- 5
The Bearish pennant pattern has formed on the #NTDOY H1 chart. This pattern type is characterized by a slight slowdown after which the price will move in the direction
Open chart in a new windowThe Double Top pattern has been formed on #TSLA M5. It signals that the trend has been changed from upwards to downwards. Probably, if the base of the pattern 312.63
The M5 and M15 time frames may have more false entry points.
Open chart in a new windowThe Bearish pennant pattern has formed on the #NTDOY M30 chart. This pattern type is characterized by a slight slowdown after which the price will move in the direction
Open chart in a new window