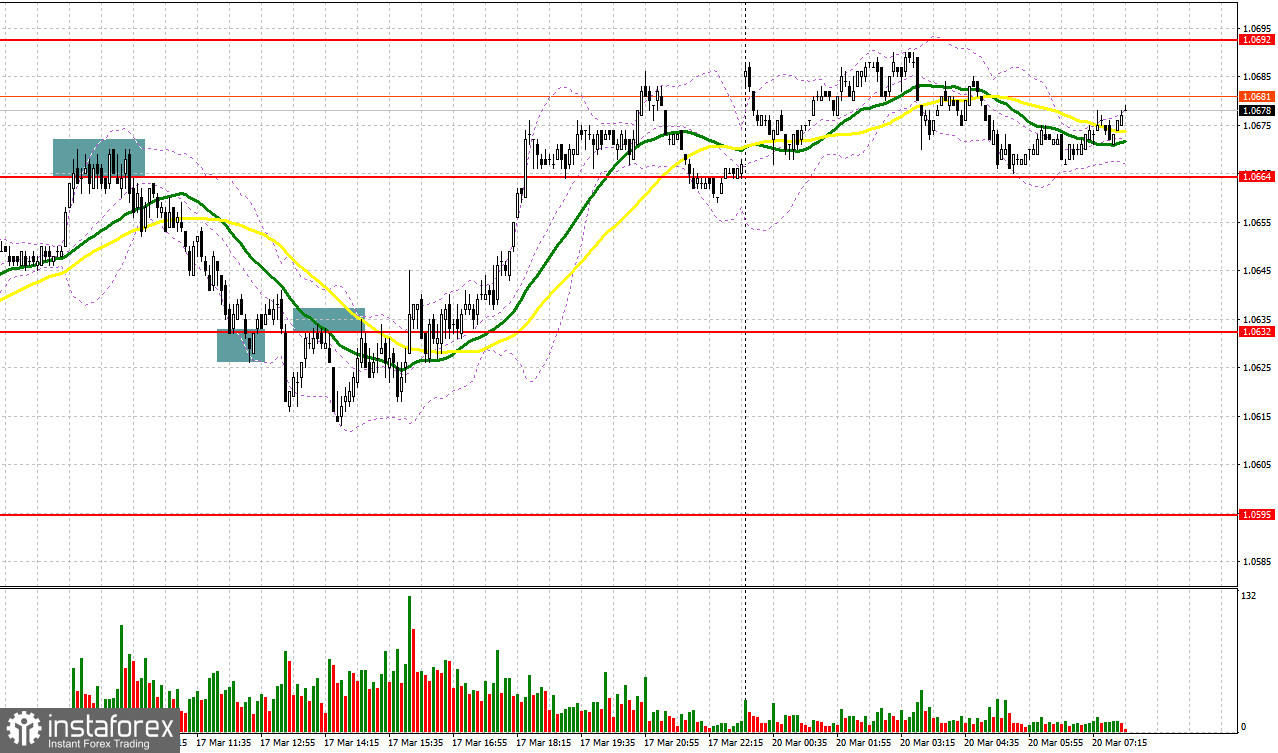
Last Friday, there were several entry points. Now, let's look at the 5-minute chart and figure out what actually happened. In my morning article. In my morning article, I turned your attention to 1.0664 and recommended making decisions with this level in focus. A rise and a false breakout of 1.0664 led to a sell signal. After that, the pair fell by more than 30 pips, testing the support level of 1.0632. A false breakout of this level gave a buy signal but the pair failed to climb. A breakout of 1.0632 and an upward retest of this level in the afternoon provided entry points into short positions. The pair declined by only 17 pips from the entry point.
When to open long positions on EUR/USD:
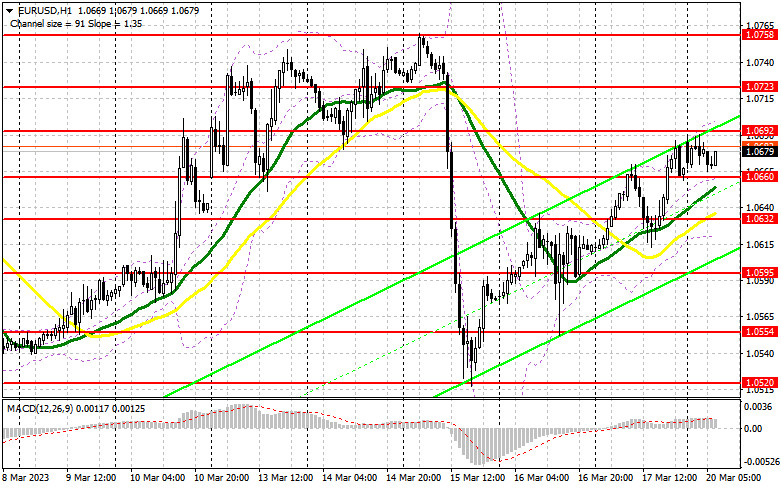
Inflation in the eurozone remains high. The latest US inflation reports signaled a slowdown in economic expansion. These factors facilitated bullish sentiment. Today, there will be no important economic reports. For this reason, traders will be mainly focused on the speech of ECB President Christine Lagarde. Germany's Producer Price Index and the eurozone trade balance will hardly stir market volatility. In her speech, Christine Lagarde may speak about Friday's inflation data, which may trigger a further strengthening of the euro against the US dollar. In case of a negative reaction and a decline in the euro, I would advise you to open long positions at the support level of 1.0660. A false breakout of this level will give a buy signal within the bullish trend. The pair may rise to 1.0692. A breakout and a downward retest of this level could create new entry points into long positions with a jump to 1.0723. It will be extremely hard for the bulls to push the pair above this level. A breakout of 1.0723 will force the bears to close their Stop Loss orders, giving an additional buy signal with the likelihood of moving to a monthly high of 1.0758. At this level, I recommend locking in profits. If EUR/USD declines and buyers show no activity at 1.0660, which is also likely, since the pressure on the euro may return at any moment, a breakout of this level could trigger a fall to the support level of 1.0632. At this level, the moving averages are benefiting the bulls. Only a false breakout of this level will provide new entry points into long positions. You could buy EUR/USD at a bounce from 1.0595 or 1.0554, keeping in mind an upward intraday correction of 30-35 pips.
When to open short positions on EUR/USD:
Sellers on Friday tried to regain the upper hand but the bulls took advantage of the market situation. They opened long positions after the fall in the pair at the end of the week. Now, the bears need to protect the resistance level of 1.0692. A test of this level may occur in the morning. I would advise you to open new short positions after a false breakout there. It could lead to a decline to the support level of 1.0660. Below this level, the moving averages are passing in positive territory. A breakout and an upward test of this level will trigger a further downward movement. It could generate entry points into short positions with a decrease to 1.0632 and 1.0595. A slide below this level after the speech of ECB President Christine Lagarde could lead to a more significant drop to 1.0554 where I recommend locking in profits. If EUR/USD rises during the European session and bears show no energy at 1.0692, I would advise you to postpone short positions until a breakout of 1.0723. You could sell EUR/USD at a bounce from 1.0758, keeping in mind a downward intraday correction of 30-35 points.
COT report
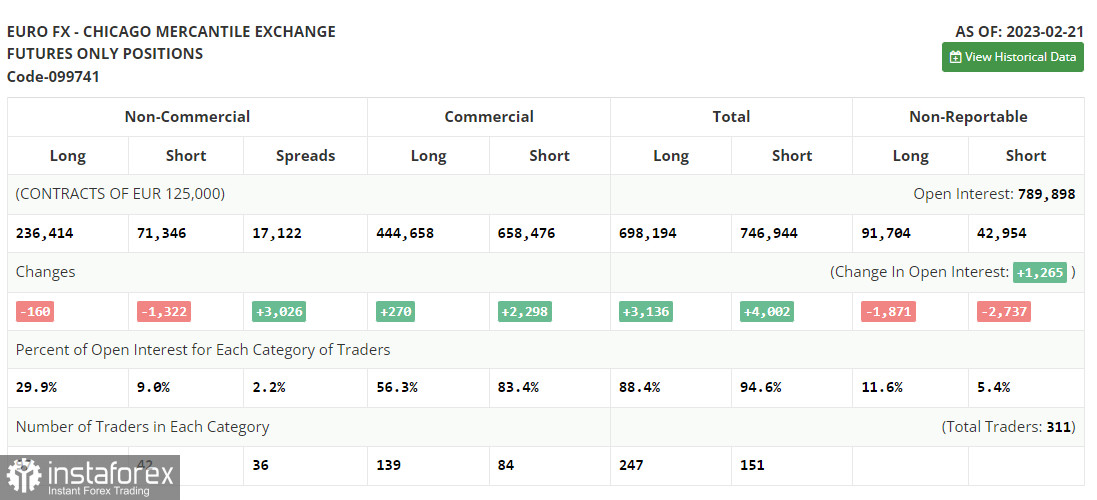
The COT report for February 21 logged a decrease in both long and short positions. In fact, the COT data from a month ago is of little interest at this point as it is not relevant due to the technical glitch the CFTC recently suffered. This week, traders are looking forward to the inflation data in the US which may support the view about the Fed's possible abandonment of aggressive monetary policy. The SVB meltdown and risks of a collapse in the US banking sector will surely change the Fed's stance on rate hikes. According to the COT report, long non-commercial positions decreased by 160 to 236,414. Short non-commercial positions dropped by 1,322 to 71,346. The non-commercial net position came in at 165,038 versus 150,509. The weekly closing price fell to 1.0698 from 1.0742.
Indicators' signals:
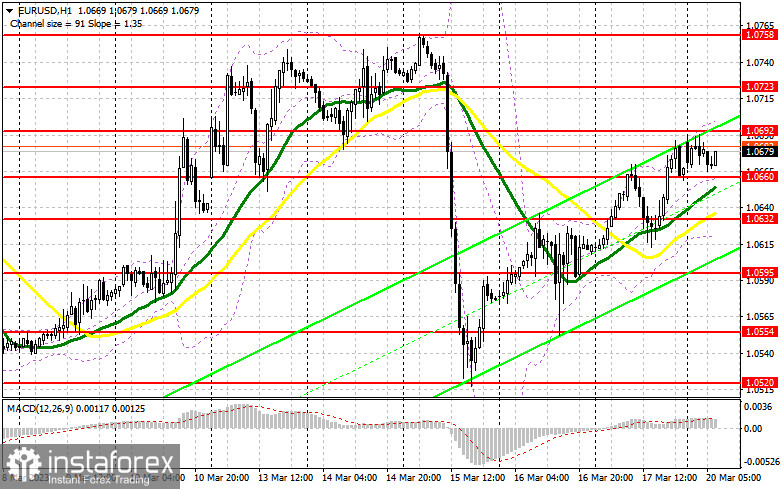
Trading is carried out above the 30 and 50 daily moving averages, which indicates bulls' attempts to take control.
Moving averages
Note: The period and prices of moving averages are considered by the author on the H1 (1-hour) chart and differ from the general definition of the classic daily moving averages on the daily D1 chart.
Bollinger Bands
If EUR/USD declines, the indicator's lower border at 1.0620 will serve as support.
Description of indicators
- Moving average (moving average, determines the current trend by smoothing out volatility and noise). Period 50. It is marked yellow on the chart.
- Moving average (moving average, determines the current trend by smoothing out volatility and noise). Period 30. It is marked green on the chart.
- MACD indicator (Moving Average Convergence/Divergence — convergence/divergence of moving averages) Quick EMA period 12. Slow EMA period to 26. SMA period 9
- Bollinger Bands (Bollinger Bands). Period 20
- Non-commercial speculative traders, such as individual traders, hedge funds, and large institutions that use the futures market for speculative purposes and meet certain requirements.
- Long non-commercial positions represent the total long open position of non-commercial traders.
- Short non-commercial positions represent the total short open position of non-commercial traders.
- Total non-commercial net position is the difference between the short and long positions of non-commercial traders.