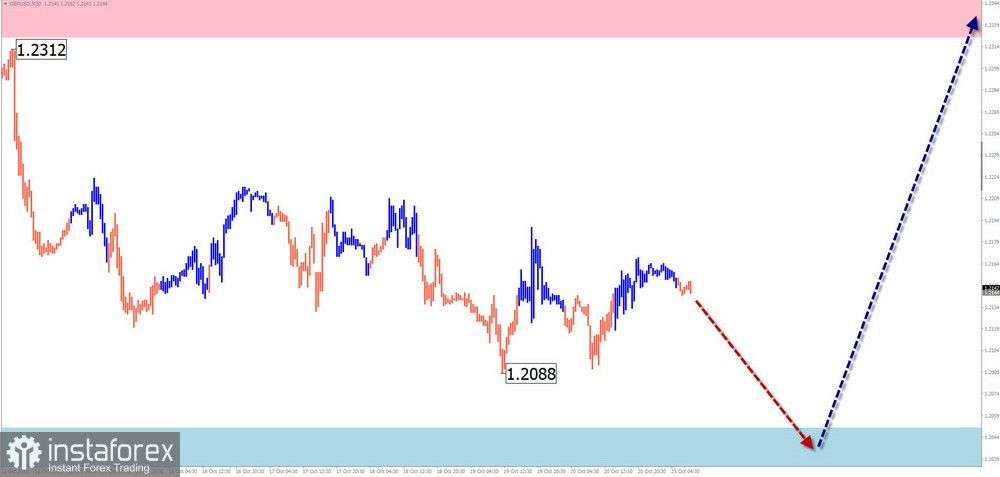
GBP/USD
Brief Analysis:
On the British pound chart, a large-scale descending wave has been forming since the beginning of September. Throughout October, a complex corrective pattern in the form of a shifting flat structure has been developing within the wave. At the time of the analysis, it did not show signs of completion. The price is near the lower boundary of a strong potential reversal zone in the weekly time frame.
Weekly Forecast:
At the beginning of the upcoming week, the completion of the price decrease of the British pound is expected, down to the support zone. Following that, a reversal formation and the beginning of a price increase can be anticipated. The resistance zone demonstrates the most probable level of the week's pair trajectory completion.
Potential Reversal Zones
Resistance:
Support:
Recommendations:
Purchases: This will become possible with a fractional lot size after the appearance of corresponding reversal signals in the support area.
Sales: Have limited potential. It is recommended to reduce the lot size and close deals at the first reversal signals.
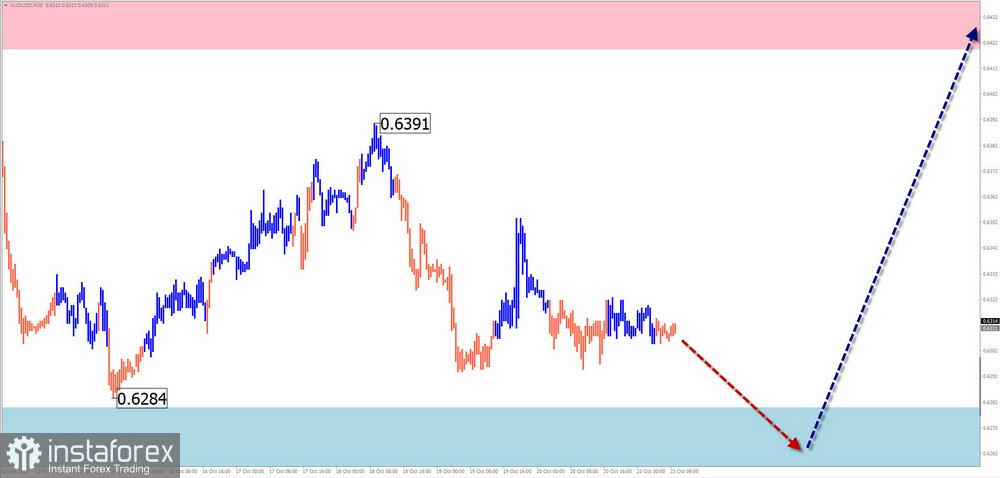
AUD/USD
Brief Analysis:
A descending trend continues on the main Australian dollar pair's chart. An unfinished segment started on August 11. Within its structure, the current month has seen a counter-correction in the form of an elongated flat. This wave segment is in its final phase.
Weekly Forecast:
At the beginning of the upcoming week, a movement along the upper boundary of the support is expected. Subsequently, a reversal and the resumption of price increases can be expected. Its completion is most likely within the boundaries of the resistance zone.
Potential Reversal Zones
Resistance:
Support:
Recommendations:
Sales: are quite risky and are not recommended in the coming days.
Purchases: will become possible after the appearance of reversal signals in the support area, according to your trading system.
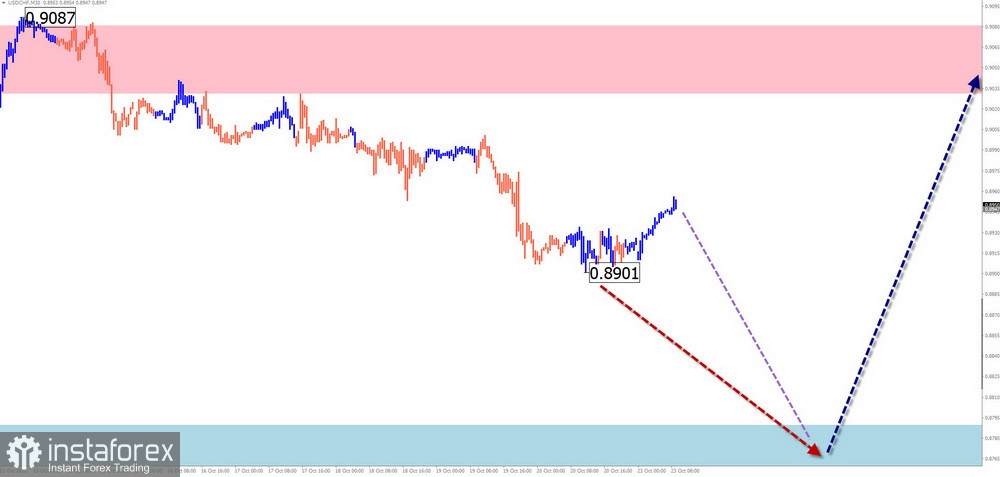
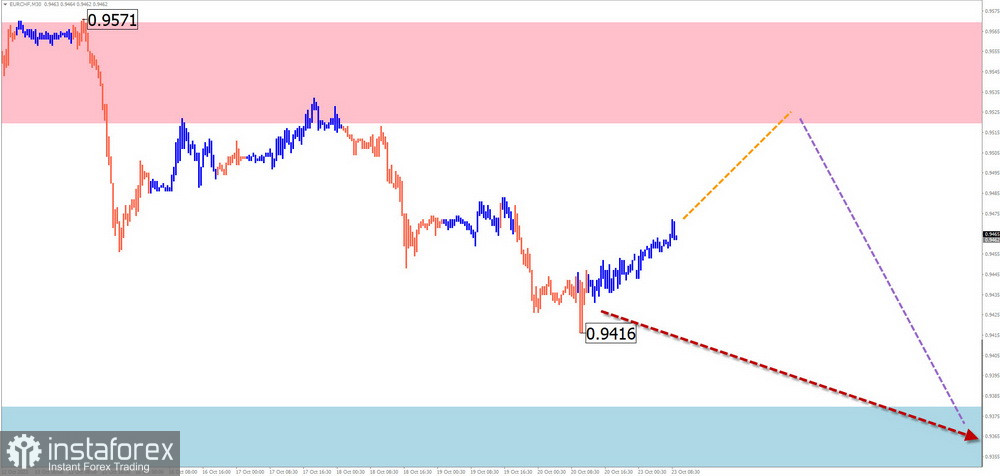
USD/CHF
Brief Analysis:
An unfinished bearish wave on the major Swiss Franc chart has been counting since the beginning of November last year. Since a powerful support level in mid-July, the price has been forming a correctional zigzag. At the time of the analysis, the middle part of the wave construction is unfolding.
Weekly Forecast:
A downward trajectory is likely in the next couple of days. Subsequently, an activation and resumption of the upward trajectory are to be expected. The upper boundary of the expected weekly pair trajectory is represented by the calculated resistance.
Potential Reversal Zones
Resistance:
Support:
Recommendations
Sales: Can be used with a fractional lot size for intraday trading in the coming days.
Purchases: will become relevant after the appearance of corresponding signals in the support zone.
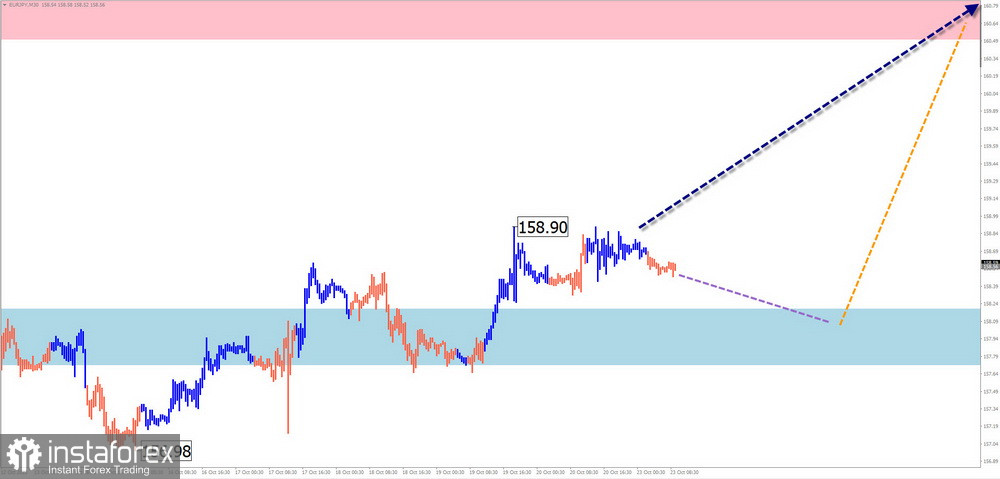
EUR/JPY
Brief Analysis:
Since March of this year, an ascending wave has determined the main direction of the euro against the Japanese yen. An unfinished segment started on September 26. Over the past two weeks, the price has broken through a strong resistance level and has subsequently relied on it as support. Within this zone, the middle part of the short-term wave (B) has been forming.
Weekly Forecast:
In the next few days, there is a probability of a sideways movement along the support levels. Closer to the weekend, an increase in volatility, a reversal, and a return to the main course of movement can be expected.
Potential Reversal Zones
Resistance:
Support:
Recommendations
Sales: highly risky and may lead to losses.
Purchases: May be recommended after the appearance of reversal signals in the support area, as confirmed by your trading system.
EUR/CHF
Brief Analysis:
On the euro-to-swiss franc cross chart, a descending trend dominates. An unfinished wave structure in the main direction started in mid-January. Within this, a counter-correction was developed on September 26. The subsequent decline marked the beginning of the final segment (C).
Weekly Forecast:
In the next few days, a flat trend and a short-term retracement towards the resistance zone are likely. Subsequently, a shift to a sideways movement with a reversal formation can be expected. By the end of the week, a resumption of the price decrease can be expected, down to the support levels.
Potential Reversal Zones
Resistance:
Support:
Recommendations
Purchases: have limited potential. Consider reducing your lot size to a minimum and closing deals at the first signs of a reversal.
Sales: will become relevant after the appearance of corresponding signals in the resistance zone, according to your trading systems.
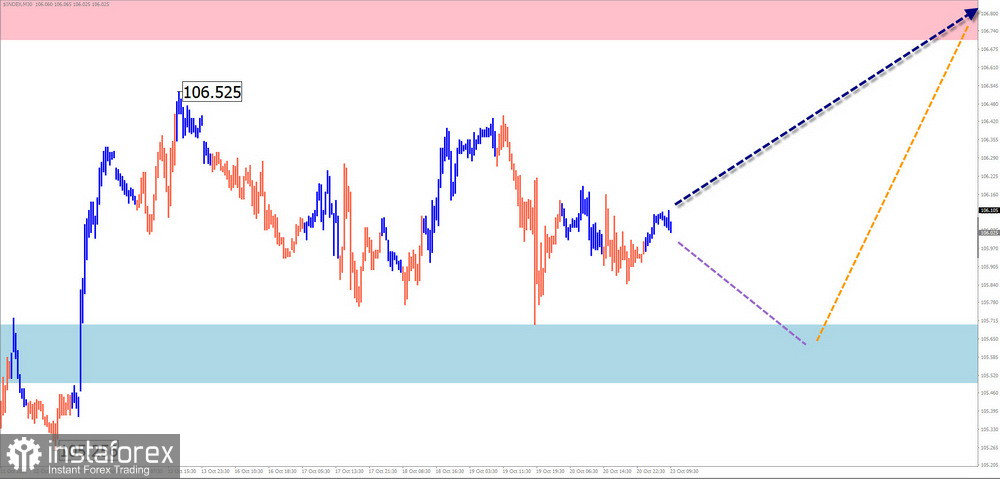
US dollar index
Brief Analysis:
The dollar index continues to recover previously lost positions. Prices rebounded downward from the lower boundary of a strong resistance zone, forming a correctional flat. The current level does not yet indicate reversal potential. The opposing movement remains within the bounds of the correction of the last trending segment.
Weekly Forecast:
At the beginning of the week, a short-term decline in support levels is not ruled out. Subsequently, amidst growing volatility, a resumption of the index's price increase is expected, with quotes rising towards the resistance zone.
Potential Reversal Zones
Resistance:
Support:
Recommendations
Purchases: Betting on a stable rise in national currencies in major pairs is premature.
Sales: In the second half of the week, they will become preferable in all major pairs.
Explanation: In simplified wave analysis (SWA), all waves consist of three parts (A, B, and C). On each timeframe (TF), the last unfinished wave is analyzed. Dashed lines indicate expected movements.
Note: The wave algorithm does not consider the duration of movements in time.