signal strength 1 of 5
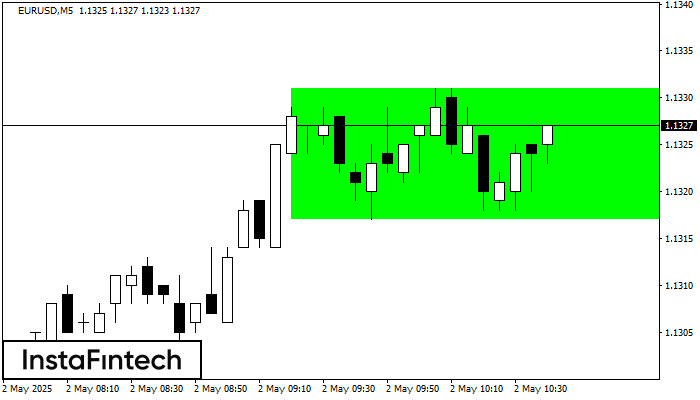
According to the chart of M5, EURUSD formed the Bullish Rectangle. The pattern indicates a trend continuation. The upper border is 1.1331, the lower border is 1.1317. The signal means that a long position should be opened above the upper border 1.1331 of the Bullish Rectangle.
The M5 and M15 time frames may have more false entry points.
See Also
- All
- Double Top
- Flag
- Head and Shoulders
- Pennant
- Rectangle
- Triangle
- Triple top
- All
- #AAPL
- #AMZN
- #Bitcoin
- #EBAY
- #FB
- #GOOG
- #INTC
- #KO
- #MA
- #MCD
- #MSFT
- #NTDOY
- #PEP
- #TSLA
- #TWTR
- AUDCAD
- AUDCHF
- AUDJPY
- AUDUSD
- EURCAD
- EURCHF
- EURGBP
- EURJPY
- EURNZD
- EURRUB
- EURUSD
- GBPAUD
- GBPCHF
- GBPJPY
- GBPUSD
- GOLD
- NZDCAD
- NZDCHF
- NZDJPY
- NZDUSD
- SILVER
- USDCAD
- USDCHF
- USDJPY
- USDRUB
- All
- M5
- M15
- M30
- H1
- D1
- All
- Buy
- Sale
- All
- 1
- 2
- 3
- 4
- 5
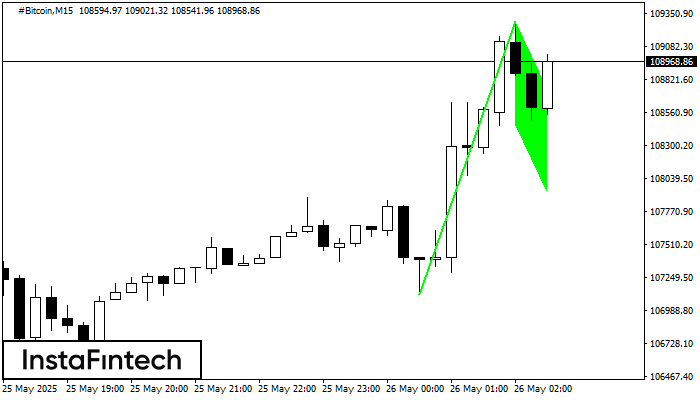
The Bullish Flag pattern has been formed on the chart #Bitcoin M15 which signals that the upward trend will continue. Signals: а break of the peak at 109285.25 may push
The M5 and M15 time frames may have more false entry points.
Open chart in a new window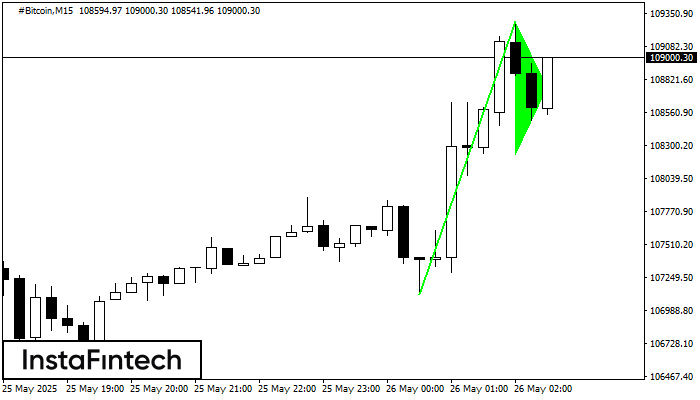
The Bullish pennant signal – Trading instrument #Bitcoin M15, continuation pattern. Forecast: it is possible to set up a buy position above the pattern’s high of 109285.25, with the prospect
The M5 and M15 time frames may have more false entry points.
Open chart in a new window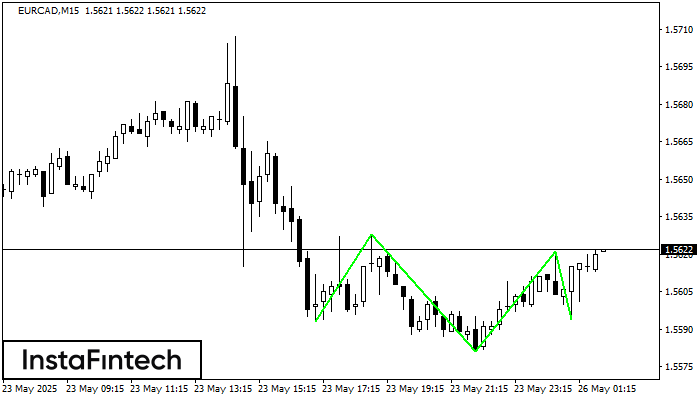
According to the chart of M15, EURCAD produced the pattern termed the Inverse Head and Shoulder. The Head is fixed at 1.5581 while the median line of the Neck
The M5 and M15 time frames may have more false entry points.
Open chart in a new window