empty
27.01.2023 09:50 PM
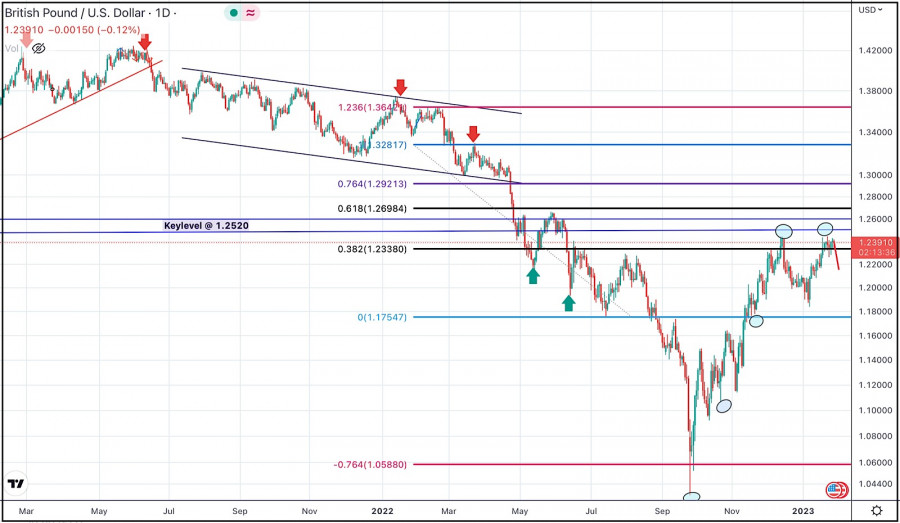
January 27, 2023 : GBP/USD Intraday technical analysis and significant key-levels.

This image is no longer relevant

Previously, the GBP/USD pair remained under bearish pressure to challenge the prominent daily bottom established around 1.1750 which was bypassed shortly after.

However, considerable bullish momentum was initiated around 1.0400-1.0600 that could prevent further bearish decline.

As the market was pursuing the current bullish movement, the newly-established ascending bottoms around 1.1150 and 1.1750 remained defended by the bulls. That's why, further bullish continuation above 1.1765 was expected.

Price action around 1.2340 was being watched for bearish rejection and a short-term SELL Entry. It was running in profits until the current bullish bounce has been expressed.

Please take into consideration that bullish breakout above 1.2340 will probably enable further advancement towards 1.2700.

On the other hand, another bearish pullback towards the price levels of 1.1750 should be expected for another long-term BUY Entry with initial target around 1.2350.

Mohamed Samy,
InstaForex के विश्लेषणात्मक विशेषज्ञ
© 2007-2025
समय सीमा चुनें
5
मिनट
15
मिनट
30
मिनट
1
घंटा
4
घंटे
1
दिन
1
सप्ताह
Earn on cryptocurrency rate changes with InstaForex
Download MetaTrader 4 and open your first trade
  • Grand Choice
    Contest by
    InstaForex
    InstaForex always strives to help you
    fulfill your biggest dreams.
    कॉन्टेस्ट में हिस्सा लें

अनुशंसित लेख

USD/IDR विदेशी मुद्रा युग्मों की दैनिक मूल्य चाल का तकनीकी विश्लेषण, सोमवार 23 जून, 2025।

16473.27 वर्तमान में दैनिक चार्ट पर, विदेशी USD/IDR मुद्रा युग्म में एक बुलिश 123 पैटर्न मौजूद है, जो संकेत देता है कि USD/IDR वर्तमान में मजबूत हो रहा है। इसे

Arief Makmur 07:57 2025-06-23 UTC+2

क्रूड ऑयल कमोडिटी इंस्ट्रूमेंट की इंट्राडे मूल्य चाल का तकनीकी विश्लेषण, सोमवार 23 जून, 2025।

4-घंटे के चार्ट पर क्रूड ऑयल की कीमत की चाल और स्टोकास्टिक ऑस्सीलेटर संकेतक के बीच डाइवर्जेंस (विरुद्धता) के प्रकट होने के साथ-साथ एक बेअरिश 123 पैटर्न और एक ट्रायंगल

Arief Makmur 07:56 2025-06-23 UTC+2

23 जून, 2025 के लिए तेल पूर्वानुमान

क्रूड ऑयल (CL) साप्ताहिक चार्ट पर, मार्लिन ऑस्सीलेटर की सिग्नल लाइन 9.3600 स्तर से पलटने लगी है। ऐतिहासिक रूप से, इस स्तर ने महत्वपूर्ण नीचे की ओर पलटाव चिह्नित किए

Laurie Bailey 07:52 2025-06-23 UTC+2

20 जून 2025 के लिए AUD/USD पूर्वानुमान

AUD/USD कल, ऑस्ट्रेलियाई डॉलर ने निचली छाया के साथ MACD रेखा को भेद दिया और लगभग 0.6446 पर समर्थन स्तर का परीक्षण किया। आज सुबह MACD रेखा के ऊपर मूल्य

Laurie Bailey 20:29 2025-06-20 UTC+2

20 जून 2025 के लिए EUR/USD पूर्वानुमान

EUR/USD संघीय रिजर्व की बैठक के बाद पिछले 24 घंटों में, बाजारों ने अपनी चिंता को दूर कर दिया है और व्यापक जोखिम-पर-प्रवृत्ति को फिर से शुरू कर दिया है।

Laurie Bailey 20:27 2025-06-20 UTC+2

इंट्राडे मूल्य आंदोलन EUR/GBP क्रॉस करेंसी जोड़े का तकनीकी विश्लेषण, गुरुवार 19 जून, 2025।

4 घंटे के चार्ट पर EUR/GBP की कीमत WMA (21) से ऊपर जा रही है, जिसका ढलान ऊपर की ओर जा रहा है और EUR/GBP की कीमत की चाल

Arief Makmur 20:40 2025-06-19 UTC+2

नैस्डैक 100 इंडेक्स के दैनिक मूल्य आंदोलन का तकनीकी विश्लेषण, गुरुवार 19 जून, 2025।

हालाँकि अपने दैनिक चार्ट पर नैस्डैक 100 इंडेक्स WMA (30 शिफ्ट 2) से ऊपर चलता हुआ दिखाई देता है, जिसका ढलान ऊपर की ओर जा रहा है, लेकिन 22105.2-21891.3 के

Arief Makmur 20:38 2025-06-19 UTC+2

चांदी वस्तु उपकरण की इंट्राडे मूल्य चाल का तकनीकी विश्लेषण, बुधवार 18 जून, 2025।

चांदी वस्तु उपकरण 4-घंटे के चार्ट पर अभी भी अपने बुलिश रुझान के भीतर चल रहा है, जिसे WMA (21) द्वारा पुष्टि मिलती है जिसका ढलान ऊपर की ओर है

Arief Makmur 08:04 2025-06-18 UTC+2

ऑस्ट्रेलियाई डॉलर/जापानी येन (AUD/JPY) क्रॉस करेंसी पेयर्स के इंट्राडे मूल्य आंदोलन का तकनीकी विश्लेषण, बुधवार 18 जून, 2025।

4-घंटे के चार्ट पर AUD/JPY की कीमत की चाल और Stochastic Oscillator संकेतक के बीच विचलन (Divergence) प्रकट होने के साथ-साथ कीमत की स्थिति जो अभी भी WMA (21) के

Arief Makmur 08:02 2025-06-18 UTC+2

सोने (गोल्ड) कमोडिटी इंस्ट्रूमेंट की इंट्राडे प्राइस मूवमेंट का तकनीकी विश्लेषण, मंगलवार 17 जून, 2025

4-घंटे के चार्ट पर, सोने (गोल्ड) कमोडिटी इंस्ट्रूमेंट में गोल्ड की कीमत की चाल और स्टोकास्टिक ऑस्सीलेटर इंडिकेटर के बीच विचलन (डाइवर्जेंस) दिखाई दे रहा है, जो संकेत देता है

Arief Makmur 07:30 2025-06-17 UTC+2
अभी बात नहीं कर सकते?
अपना प्रश्न पूछें बातचीत.
Widget callback
 

Dear visitor,

Your IP address shows that you are currently located in the USA. If you are a resident of the United States, you are prohibited from using the services of InstaFintech Group including online trading, online transfers, deposit/withdrawal of funds, etc.

If you think you are seeing this message by mistake and your location is not the US, kindly proceed to the website. Otherwise, you must leave the website in order to comply with government restrictions.

Why does your IP address show your location as the USA?

  • - you are using a VPN provided by a hosting company based in the United States;
  • - your IP does not have proper WHOIS records;
  • - an error occurred in the WHOIS geolocation database.

Please confirm whether you are a US resident or not by clicking the relevant button below. If you choose the wrong option, being a US resident, you will not be able to open an account with InstaForex anyway.

We are sorry for any inconvenience caused by this message.