empty
08.02.2023 06:03 PM
EUR/USD: rebound seems over

The EUR/USD pair tried to rebound in the short term but the downside pressure remains high. It's located at 1.0715 at the time of writing and it seems very heavy. After its massive sell-off post the NFPs, ISM Services PMI, and Unemployment Rate positive data, a temporary rebound comes as no surprise.

Yesterday, the US Trade Balance came in at -67.4B versus -68.5B estimates, while today, the Final Wholesale Inventories rose by 0.1% matching expectations. Tomorrow, the Unemployment Claims are expected at 191K versus 183K in the previous reporting period. Also, the Prelim UoM Consumer Sentiment could really shake the markets on Friday.

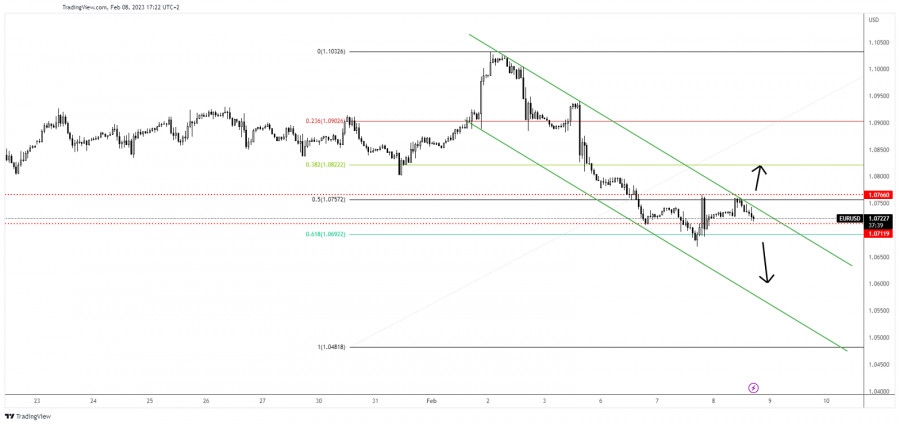
EUR/USD Down Channel!

This image is no longer relevant

EUR/USD rebounded but it has found resistance at the 50% resistance level and at the downtrend line. As long as it stays below the downtrend line, the rate could develop a larger drop.

The current sideways movement could represent a downside continuation pattern. Only a valid breakout through 1.0766 and through the downtrend line invalidates the bearish scenario.

EUR/USD Forecast!

Dropping again below the 61.8% Fibonacci level (1.06922) and making a new lower low activates a downside continuation and represents a new selling opportunity.

Ralph Shedler,
InstaForex के विश्लेषणात्मक विशेषज्ञ
© 2007-2025
समय सीमा चुनें
5
मिनट
15
मिनट
30
मिनट
1
घंटा
4
घंटे
1
दिन
1
सप्ताह
Earn on cryptocurrency rate changes with InstaForex
Download MetaTrader 4 and open your first trade
  • Grand Choice
    Contest by
    InstaForex
    InstaForex always strives to help you
    fulfill your biggest dreams.
    कॉन्टेस्ट में हिस्सा लें

अनुशंसित लेख

इंट्राडे मूल्य आंदोलन EUR/GBP क्रॉस करेंसी जोड़े का तकनीकी विश्लेषण, गुरुवार 19 जून, 2025।

4 घंटे के चार्ट पर EUR/GBP की कीमत WMA (21) से ऊपर जा रही है, जिसका ढलान ऊपर की ओर जा रहा है और EUR/GBP की कीमत की चाल

Arief Makmur 20:40 2025-06-19 UTC+2

नैस्डैक 100 इंडेक्स के दैनिक मूल्य आंदोलन का तकनीकी विश्लेषण, गुरुवार 19 जून, 2025।

हालाँकि अपने दैनिक चार्ट पर नैस्डैक 100 इंडेक्स WMA (30 शिफ्ट 2) से ऊपर चलता हुआ दिखाई देता है, जिसका ढलान ऊपर की ओर जा रहा है, लेकिन 22105.2-21891.3 के

Arief Makmur 20:38 2025-06-19 UTC+2

चांदी वस्तु उपकरण की इंट्राडे मूल्य चाल का तकनीकी विश्लेषण, बुधवार 18 जून, 2025।

चांदी वस्तु उपकरण 4-घंटे के चार्ट पर अभी भी अपने बुलिश रुझान के भीतर चल रहा है, जिसे WMA (21) द्वारा पुष्टि मिलती है जिसका ढलान ऊपर की ओर है

Arief Makmur 08:04 2025-06-18 UTC+2

ऑस्ट्रेलियाई डॉलर/जापानी येन (AUD/JPY) क्रॉस करेंसी पेयर्स के इंट्राडे मूल्य आंदोलन का तकनीकी विश्लेषण, बुधवार 18 जून, 2025।

4-घंटे के चार्ट पर AUD/JPY की कीमत की चाल और Stochastic Oscillator संकेतक के बीच विचलन (Divergence) प्रकट होने के साथ-साथ कीमत की स्थिति जो अभी भी WMA (21) के

Arief Makmur 08:02 2025-06-18 UTC+2

सोने (गोल्ड) कमोडिटी इंस्ट्रूमेंट की इंट्राडे प्राइस मूवमेंट का तकनीकी विश्लेषण, मंगलवार 17 जून, 2025

4-घंटे के चार्ट पर, सोने (गोल्ड) कमोडिटी इंस्ट्रूमेंट में गोल्ड की कीमत की चाल और स्टोकास्टिक ऑस्सीलेटर इंडिकेटर के बीच विचलन (डाइवर्जेंस) दिखाई दे रहा है, जो संकेत देता है

Arief Makmur 07:30 2025-06-17 UTC+2

जीबीपी/जेपीवाई क्रॉस करेंसी जोड़ी के इंट्राडे प्राइस मूवमेंट का तकनीकी विश्लेषण, मंगलवार 17 जून, 2025।

अगर हम 4-घंटे के चार्ट को देखें, तो जीबीपी/जेपीवाई क्रॉस करेंसी जोड़ी में बुलिश बायस देखा जाता है, जिसे इसकी प्राइस मूवमेंट भी पुष्टि करती है। यह प्राइस मूवमेंट

Arief Makmur 07:28 2025-06-17 UTC+2

कच्चे तेल कमोडिटी उपकरण की इंट्राडे मूल्य गति का तकनीकी विश्लेषण, सोमवार, 16 जून, 2025।

कच्चे तेल कमोडिटी उपकरण के 4-घंटे के चार्ट पर, #CL कीमत की चाल और Stochastic Oscillator संकेतक के बीच डाइवर्जेंस दिखाई दे रहा है, जो संकेत देता है कि निकट

Arief Makmur 07:43 2025-06-16 UTC+2

यूएसडी/आईडीआर विदेशी मुद्रा जोड़े के दैनिक मूल्य गति का तकनीकी विश्लेषण, सोमवार, 16 जून, 2025।

इस विदेशी मुद्रा जोड़े की कमजोर होती स्थिति के बीच बुलिश 123 पैटर्न के प्रकट होने के साथ, जिसे USD/IDR की कीमत की चाल द्वारा पुष्टि मिली है, जो

Arief Makmur 07:42 2025-06-16 UTC+2

नास्डैक 100 सूचकांक के इंट्राडे मूल्य आंदोलन का तकनीकी विश्लेषण, गुरुवार 12 जून, 2025।

नास्डैक 100 सूचकांक के 4-घंटे के चार्ट पर, इसकी कीमत की चाल और स्टोकेस्टिक ऑस्सीलेटर संकेतक के बीच विसंगति है, खासकर तब जब वर्तमान में #NDX की कीमत EMA (21)

Arief Makmur 14:03 2025-06-12 UTC+2

क्रूड ऑयल कमोडिटी इंस्ट्रूमेंट की दैनिक मूल्य चाल का तकनीकी विश्लेषण, गुरुवार 12 जून, 2025।

अगर हम क्रूड ऑयल कमोडिटी इंस्ट्रूमेंट के दैनिक चार्ट को देखें, तो #CL की मूल्य चाल और स्टोकास्टिक ऑस्सीलेटर इंडिकेटर के बीच एक विचलन दिखाई देता है, जो इस बात

Arief Makmur 13:57 2025-06-12 UTC+2
अभी बात नहीं कर सकते?
अपना प्रश्न पूछें बातचीत.
Widget callback
 

Dear visitor,

Your IP address shows that you are currently located in the USA. If you are a resident of the United States, you are prohibited from using the services of InstaFintech Group including online trading, online transfers, deposit/withdrawal of funds, etc.

If you think you are seeing this message by mistake and your location is not the US, kindly proceed to the website. Otherwise, you must leave the website in order to comply with government restrictions.

Why does your IP address show your location as the USA?

  • - you are using a VPN provided by a hosting company based in the United States;
  • - your IP does not have proper WHOIS records;
  • - an error occurred in the WHOIS geolocation database.

Please confirm whether you are a US resident or not by clicking the relevant button below. If you choose the wrong option, being a US resident, you will not be able to open an account with InstaForex anyway.

We are sorry for any inconvenience caused by this message.