empty
28.11.2022 10:17 AM
EUR/USD and GBP/USD: trading plan for beginners on November 28

Specifics of economic calendar on November 25

The last trading week ended with an empty economic calendar and low trading volumes. The reason is the public holiday in the US, Thanksgiving Day. Thus, Thursday was a day-off and Friday was a shorter trading day.

Overview of technical charts on November 25

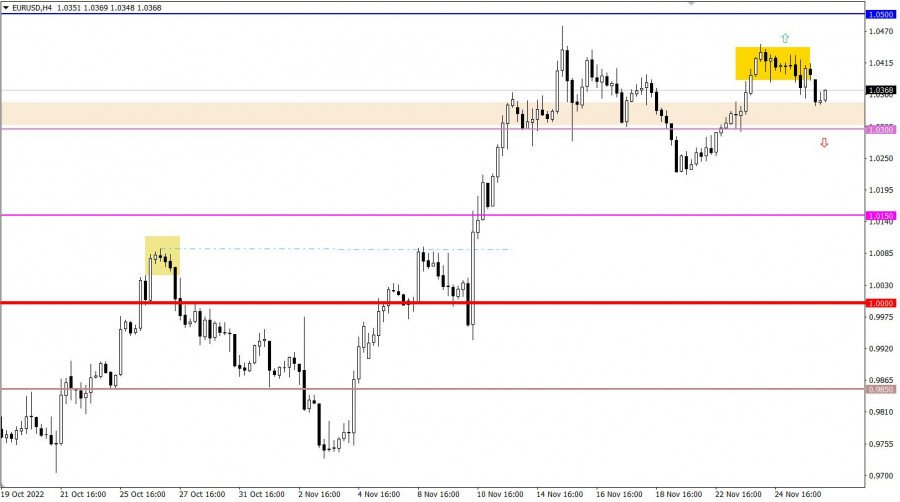
Having reached the peak of the upward cycle, EUR/USD entered the range-bound market. The price escaped the trading range, pushed downwards by speculative activity. As a result, the currency pair went below 1.0350.

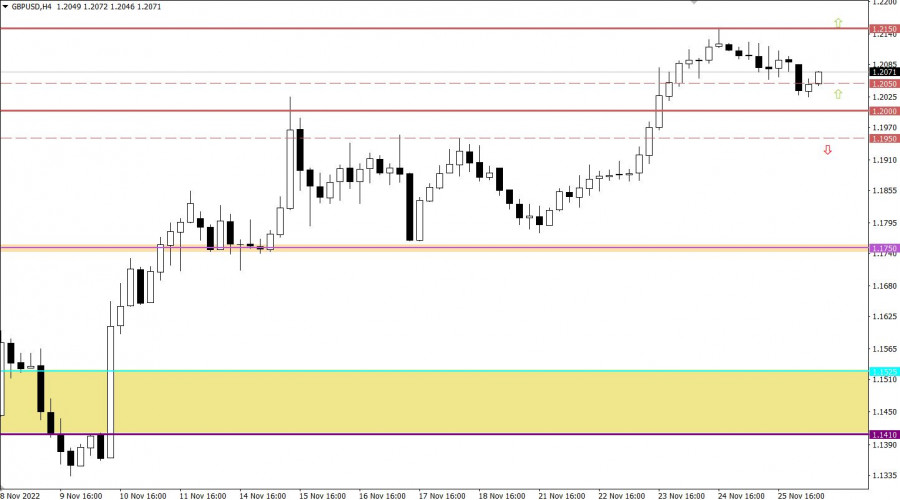
GBP/USD climbed to the interim resistance at 1.2150. Then, traders decided to accumulate short positions bit by bit. Eventually, the instrument began a retracement stage and the price rebounded to the upper border and psychological level of 1.2000 (1.2000/1.2050).

This image is no longer relevant

Economic calendar on November 28

All market players are resuming trading on Monday. Nevertheless, the week is opening with an empty economic calendar. Therefore, all investors and speculators can do is monitor the information environment and grasp breaking news from mass media.

Trading plan for EUR/USD on November 28

In this situation, if the price settles firmly below 1.0350, this may assure traders to increase short positions towards 1.03000, the level passed earlier. Further sellers' activity will depend on how the price will behave at around 1.0300.

This image is no longer relevant

Trading plan for GBP/USD on November 28

Under such market conditions, the psychological level of 1.2000 could serve as a pivot point for the sellers which in turn, will assure traders to cut short positions. If the actual price move meets expectations, the instrument might get stuck with the following price bounce which will update the local high of the upward cycle.

As for the downward scenario, the price should settle below 1.1950 to make this forecast come true. In this case, traders could revise sentiment on GBP towards bearish.

This image is no longer relevant

What's on the charts

The candlestick chart type is white and black graphic rectangles with lines above and below. With a detailed analysis of each individual candle, you can see its characteristics relative to a particular time frame: opening price, closing price, intraday high and low.

Horizontal levels are price coordinates, relative to which a price may stop or reverse its trajectory. In the market, these levels are called support and resistance.

Circles and rectangles are highlighted examples where the price reversed on history. This color highlighting indicates horizontal lines that may put pressure on the asset's price in the future.

The up/down arrows are landmarks of the possible price direction in the future.

Gven Podolsky,
InstaForex के विश्लेषणात्मक विशेषज्ञ
© 2007-2025
समय सीमा चुनें
5
मिनट
15
मिनट
30
मिनट
1
घंटा
4
घंटे
1
दिन
1
सप्ताह
Earn on cryptocurrency rate changes with InstaForex
Download MetaTrader 4 and open your first trade
  • Grand Choice
    Contest by
    InstaForex
    InstaForex always strives to help you
    fulfill your biggest dreams.
    कॉन्टेस्ट में हिस्सा लें

अनुशंसित लेख

EUR/USD के लिए 11 जून की ट्रेडिंग सिफारिशें और विश्लेषण: उच्च स्तर पर स्थिर गति

EUR/USD मुद्रा जोड़ी मंगलवार को दोनों दिशाओं में बढ़ती-घटती रही। ये हलचल एक स्थिर (फ्लैट) बाजार का संकेत देती हैं। याद करें कि इससे पहले, यह जोड़ी दूसरी बार आरोही

Paolo Greco 08:11 2025-06-11 UTC+2

EUR/USD: 10 जून के अमेरिकी सत्र के लिए ट्रेडिंग योजना (सुबह के ट्रेडों की समीक्षा)

अपने सुबह के पूर्वानुमान में, मैंने 1.1388 के स्तर पर प्रकाश डाला और इसके आधार पर बाजार में प्रवेश के निर्णय लेने की योजना बनाई। आइए 5 मिनट के चार्ट

Miroslaw Bawulski 19:51 2025-06-10 UTC+2

GBP/USD: 10 जून को अमेरिकी सत्र के लिए ट्रेडिंग योजना (सुबह के ट्रेडों की समीक्षा)

अपने सुबह के पूर्वानुमान में, मैंने 1.3545 के स्तर पर ध्यान आकर्षित किया और बाजार में प्रवेश के निर्णय को इसके आधार पर लेने की योजना बनाई। आइए 5 मिनट

Miroslaw Bawulski 19:50 2025-06-10 UTC+2

10 जून को EUR/USD जोड़ी में कैसे ट्रेड करें? शुरुआती लोगों के लिए सरल सुझाव और ट्रेड विश्लेषण

सोमवार के ट्रेडों का विश्लेषण EUR/USD का 1H चार्ट EUR/USD मुद्रा जोड़ी ने सोमवार को कम अस्थिरता के साथ और दोनों दिशाओं में कारोबार किया। उस दिन, व्यापक आर्थिक पृष्ठभूमि

Paolo Greco 19:39 2025-06-10 UTC+2

10 जून को GBP/USD जोड़ी में कैसे ट्रेड करें? शुरुआती लोगों के लिए सरल सुझाव और ट्रेड विश्लेषण

सोमवार के ट्रेडों का विश्लेषण GBP/USD का 1H चार्ट GBP/USD जोड़ी ने सोमवार को भी दोनों दिशाओं में कारोबार किया। शुक्रवार को, कीमत आरोही ट्रेंडलाइन के नीचे समेकित हुई, जिससे

Paolo Greco 19:36 2025-06-10 UTC+2

EUR/USD के लिए 10 जून की ट्रेडिंग सिफारिशें और विश्लेषण: एक और दिन, एक और नकारात्मकता का दौर

EUR/USD मुद्रा जोड़ी ने सोमवार को मिश्रित कारोबार किया। ट्रेंडलाइन को तोड़ने के बावजूद, नीचे की ओर गिरावट (यानी अमेरिकी डॉलर का मजबूत होना) वास्तव में शुरू नहीं हुई। इसलिए

Paolo Greco 08:06 2025-06-10 UTC+2

10 जून को GBP/USD के लिए ट्रेडिंग सुझाव और विश्लेषण: पाउंड भी गिरने की जल्दी में नहीं है।

सोमवार को, GBP/USD करेंसी जोड़ी ने उम्मीद के मुताबिक अपनी नीचे की दिशा जारी नहीं रखी। याद करें कि पहले, इस जोड़ी ने एक बार फिर भालू (बेयरिश) ट्रेंड रिवर्सल

Paolo Greco 08:02 2025-06-10 UTC+2

GBP/USD: 9 जून को अमेरिकी सत्र के लिए ट्रेडिंग योजना (सुबह के ट्रेडों का विश्लेषण)

अपने सुबह के पूर्वानुमान में, मैंने 1.3581 के स्तर पर ध्यान केंद्रित किया और इसके आसपास प्रवेश निर्णयों को आधार बनाने की योजना बनाई। आइए 5 मिनट के चार्ट को

Miroslaw Bawulski 19:59 2025-06-09 UTC+2

9 जून को EUR/USD जोड़ी में कैसे ट्रेड करें? शुरुआती लोगों के लिए सरल सुझाव और ट्रेड विश्लेषण

शुक्रवार के ट्रेडों का विश्लेषण EUR/USD का 1H चार्ट शुक्रवार को EUR/USD मुद्रा जोड़ी में गिरावट देखी गई, और इसके पीछे वस्तुनिष्ठ कारण थे। हालाँकि, यह ध्यान रखना महत्वपूर्ण है

Paolo Greco 19:48 2025-06-09 UTC+2

9 जून को GBP/USD जोड़ी में कैसे ट्रेड करें? शुरुआती लोगों के लिए सरल सुझाव और ट्रेड विश्लेषण

शुक्रवार के ट्रेडों का विश्लेषण GBP/USD का 1H चार्ट GBP/USD जोड़ी ने भी EUR/USD जोड़ी के समान कारणों से शुक्रवार को कम कारोबार किया। महासागर के पार से अच्छे मैक्रोइकॉनोमिक

Paolo Greco 19:44 2025-06-09 UTC+2
अभी बात नहीं कर सकते?
अपना प्रश्न पूछें बातचीत.
Widget callback
 

Dear visitor,

Your IP address shows that you are currently located in the USA. If you are a resident of the United States, you are prohibited from using the services of InstaFintech Group including online trading, online transfers, deposit/withdrawal of funds, etc.

If you think you are seeing this message by mistake and your location is not the US, kindly proceed to the website. Otherwise, you must leave the website in order to comply with government restrictions.

Why does your IP address show your location as the USA?

  • - you are using a VPN provided by a hosting company based in the United States;
  • - your IP does not have proper WHOIS records;
  • - an error occurred in the WHOIS geolocation database.

Please confirm whether you are a US resident or not by clicking the relevant button below. If you choose the wrong option, being a US resident, you will not be able to open an account with InstaForex anyway.

We are sorry for any inconvenience caused by this message.