empty
24.01.2023 09:50 AM
Indicator analysis: Daily review of EUR/USD on January 24, 2023

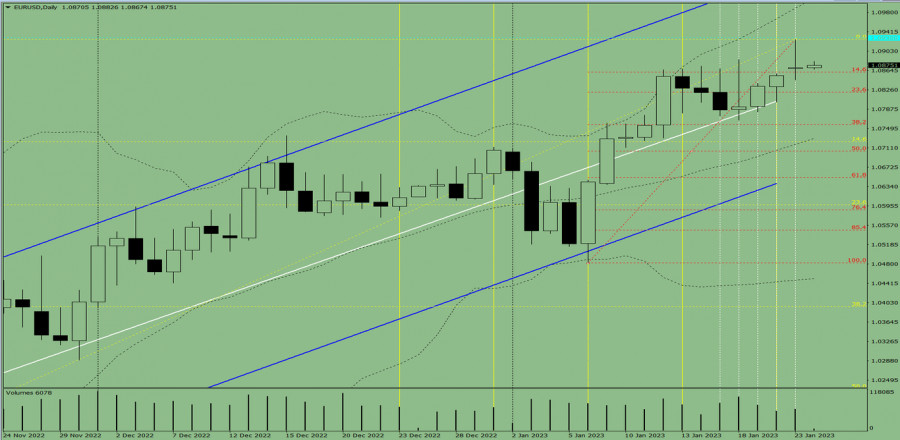
Trend analysis (Fig. 1).

The euro-dollar pair may move upward from the level of 1.0870 (closing of yesterday's daily candle) to the upper fractal at 1.0926 (yellow dotted line). When testing this level, continued upward movement is possible to 1.0989, the upper border of the Bollinger line indicator (black dotted line). Upon testing this level, the price may move down.

This image is no longer relevant

Fig. 1 (daily chart).

Comprehensive analysis:

  • Indicator analysis - up;
  • Volumes - up;
  • Candlestick analysis - up;
  • Trend analysis - up;
  • Bollinger bands - up;
  • Weekly chart - up.

General conclusion:

Today, the price may move upward from the level of 1.0870 (closing of yesterday's daily candle) to the upper fractal at 1.0926 (yellow dotted line). When testing this level, continued upward movement is possible to 1.0989, the upper border of the Bollinger line indicator (black dotted line). Upon testing this level, the price may move down.

Alternatively, the price may move upward from the level of 1.0870 (closing of yesterday's daily candle) to the upper fractal at 1.0926 (yellow dotted line). When testing this level, a downward movement is possible to 1.0861, the 14.6% retracement level (red dotted line).

Stefan Doll,
InstaForex के विश्लेषणात्मक विशेषज्ञ
© 2007-2025
समय सीमा चुनें
5
मिनट
15
मिनट
30
मिनट
1
घंटा
4
घंटे
1
दिन
1
सप्ताह
Earn on cryptocurrency rate changes with InstaForex
Download MetaTrader 4 and open your first trade
  • Grand Choice
    Contest by
    InstaForex
    InstaForex always strives to help you
    fulfill your biggest dreams.
    कॉन्टेस्ट में हिस्सा लें

अनुशंसित लेख

GBP/USD का पूर्वानुमान - 29 मई, 2025

तीन दिनों की गिरावट के बाद, ब्रिटिश पाउंड 1.3433 के लक्ष्य समर्थन स्तर पर पहुँच गया है। दैनिक चार्ट पर, मार्लिन ऑस्सीलेटर ने अभी तक अपने चढ़ते चैनल की निचली

Laurie Bailey 06:20 2025-05-29 UTC+2

AUD/USD Forecast for May 29, 2025

संयुक्त राज्य अमेरिका में आंतरिक राजनीतिक टकराव (एक अदालत के फैसले ने ट्रंप के ट्रेड टैरिफ को रद्द कर दिया) ने ऑस्ट्रेलियन डॉलर को 0.6394–0.6444 के दायरे में वापस ला

Laurie Bailey 06:06 2025-05-29 UTC+2

बुधवार, 28 मई 2025 को AUD/JPY क्रॉस करेंसी पेयर की इंट्राडे प्राइस मूवमेंट का तकनीकी विश्लेषण।

AUD/JPY मुद्रा जोड़ी की चाल और Stochastic Oscillator संकेतक के बीच अभिसरण (Convergence) दिखाई देने के साथ-साथ इसकी कीमत का WMA (21) के ऊपर होना और 4-घंटे के चार्ट में

Arief Makmur 12:49 2025-05-28 UTC+2

जीबीपी/एयूडी क्रॉस करेंसी पेयर्स की इंट्राडे मूल्य चाल का तकनीकी विश्लेषण, मंगलवार 27 मई, 2025।

अगर हम GBP/AUD क्रॉस करेंसी पेयर के 4-घंटे के चार्ट को देखें, तो यह प्रतीत होता है कि GBP/AUD की कीमत की चाल और स्टोकास्टिक ऑस्सीलेटर इंडिकेटर के बीच डाइवर्जेंस

Arief Makmur 11:43 2025-05-27 UTC+2

सोने के कमोडिटी इंस्ट्रूमेंट की इंट्राडे मूल्य चाल का तकनीकी विश्लेषण, मंगलवार 27 मई, 2025।

4-घंटे के चार्ट पर सोने की कीमतें WMA (21) के ऊपर एक बढ़ती हुई ढलान के साथ चल रही हैं, जिससे निकट भविष्य में सोना 3365.45 के स्तर तक पहुंचने

Arief Makmur 11:41 2025-05-27 UTC+2

27 मई, 2025 के लिए AUD/USD का पूर्वानुमान

सोमवार को, ऑस्ट्रेलियाई डॉलर ने प्राइस चैनल लाइन तक पहुंचने के बाद 50 से अधिक पिप्स की गिरावट दर्ज की और अंततः दिन का समापन एक काली (बेअरिश) कैंडलस्टिक के

Laurie Bailey 06:21 2025-05-27 UTC+2

तेल का पूर्वानुमान — 27 मई, 2025

क्रूड ऑयल (CL) तेल बाजार में मध्यम अवधि की गिरावट बनती हुई नजर आ रही है। सोमवार को, कीमत बैलेंस इंडिकेटर लाइन के ऊपर टूटने में नाकाम रही (ऊपर की

Laurie Bailey 06:18 2025-05-27 UTC+2

यूएसडी/आईडीआर एक्सोटिक मुद्रा जोड़ी की इंट्राडे डेली प्राइस मूवमेंट का तकनीकी विश्लेषण, सोमवार, 26 मई 2025।

एक्सोटिक मुद्रा जोड़ी USD/IDR के डेली चार्ट से जो दिखाई देता है, उससे प्रतीत होता है कि एक बेयरिश 123 पैटर्न बन चुका है, जिसके बाद एक बेयरिश रॉस हुक

Arief Makmur 11:35 2025-05-26 UTC+2

यूएसडी/जेपीवाई मुख्य मुद्रा जोड़ी की इंट्राडे प्राइस मूवमेंट का तकनीकी विश्लेषण, सोमवार, 26 मई 2025।

मुख्य मुद्रा जोड़ी USD/JPY के 4-घंटे के चार्ट पर Ascending Broadening Wedge पैटर्न को सफलतापूर्वक तोड़ने और उसके नीचे बंद होने के बाद, USD/JPY अपनी कमजोरी की दिशा में आगे

Arief Makmur 11:33 2025-05-26 UTC+2

नैस्डैक 100 सूचकांक की इंट्राडे मूल्य गति का तकनीकी विश्लेषण, गुरुवार 22 मई 2025।

नैस्डैक 100 सूचकांक की मूल्य गति में डाइवर्जेंस (विचलन) दिखाई देने के साथ, जिसमें डबल टॉप बना है, और इसके साथ स्टोकेस्टिक ऑस्सीलेटर इंडिकेटर की पुष्टि मिलती है, साथ ही

Arief Makmur 11:32 2025-05-22 UTC+2
अभी बात नहीं कर सकते?
अपना प्रश्न पूछें बातचीत.
Widget callback
 

Dear visitor,

Your IP address shows that you are currently located in the USA. If you are a resident of the United States, you are prohibited from using the services of InstaFintech Group including online trading, online transfers, deposit/withdrawal of funds, etc.

If you think you are seeing this message by mistake and your location is not the US, kindly proceed to the website. Otherwise, you must leave the website in order to comply with government restrictions.

Why does your IP address show your location as the USA?

  • - you are using a VPN provided by a hosting company based in the United States;
  • - your IP does not have proper WHOIS records;
  • - an error occurred in the WHOIS geolocation database.

Please confirm whether you are a US resident or not by clicking the relevant button below. If you choose the wrong option, being a US resident, you will not be able to open an account with InstaForex anyway.

We are sorry for any inconvenience caused by this message.