empty
08.02.2023 09:06 AM
EUR/USD wave analysis on February 8, 2023. Fed to stick to its hawkish policy

This image is no longer relevant

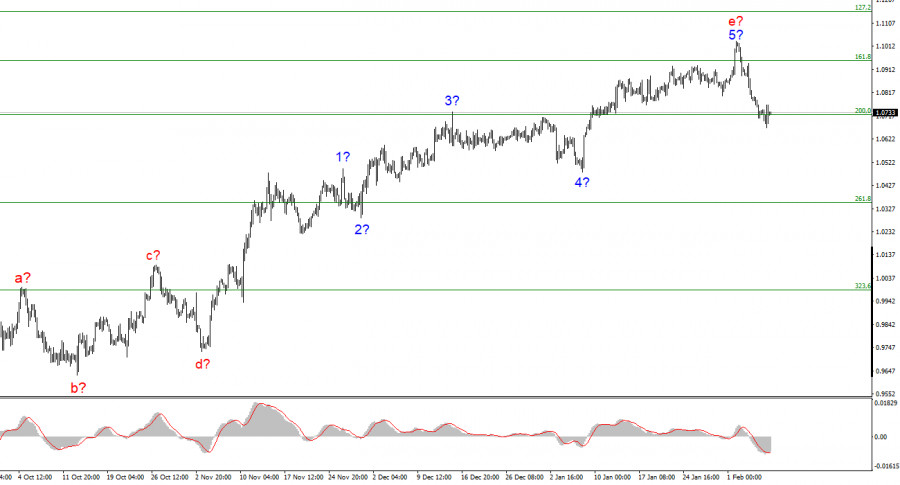
The EUR/USD wave layout on the 4-hour chart has not changed at all lately which is good for us as it gives us an understanding of how the situation may develop. The ascending section of the trend has taken a clearly corrective and extended form which looks more like a momentum section. So, we have a complex corrective wave pattern consisting of a-b-c-d-e parts where wave e has a more complex structure than the previous four waves. If the current wave setup is correct, then this structure has already been completed as the wave e turned out to be much longer than the preceding waves. If so, we can expect the formation of at least three descending waves. That is why I still anticipate a decline in the pair. In the first weeks of the year, the demand for the euro was either rising or remained consistently high. In this period, the instrument retreated from the reached highs only once. In early February, the pressure on the US dollar eased. So, the current pullback from the recent highs can be considered the start of a new descending section of the trend. Hopefully, the news background and the market sentiment won't stop the formation of descending waves.

Powell's speech moves markets

The EUR/USD pair went up by 5 pips on Tuesday. The pair was trading with sharp fluctuations throughout the day due to Jerome Powell's speech. Yet, neither the euro nor the US dollar managed to show significant results. The speech by the Fed Chair was the major event of the day. Giving a speech to the Economic Club of Washington, Powell repeated several times that the fight against rising inflation would take longer and would be more difficult than expected. This comment can have different interpretations. On the one hand, it can mean higher interest rates, expectations of a slowdown in inflation, or it can simply mean nothing. In other words, Jerome Powell repeated his previous statement that the interest rate will not be lowered in 2023. Yesterday, he was talking about the need to keep the rate at its peak levels for longer. It remains unclear whether Powell meant a more aggressive approach to monetary policy or he was talking about the need for more time to see inflation decline. The instrument first jumped by 100 pips and then declined by the same amount which indicates market confusion with Powell's words.

There were no more important events on Tuesday. Today, you should probably pay attention to the statement by FOMC members as they may give some clarity to the message from yesterday. The statement by FOMC members John C. Williams, Michael S. Barr, and Christopher J. Waller is unlikely to influence the market as traders usually prefer to rely on what Jerome Powell says.

This image is no longer relevant

Conclusion

Based on the analysis above, I can conclude that the ascending section of the trend has been completed. With this in mind, I would recommend selling the pair with the targets located at 1.0350, which corresponds to the 261.8% Fibonacci level. It is also highly possible that the ascending section of the trend will get a more extended form. For the first time in recent weeks, we see the signs of a new descending section of the trend.

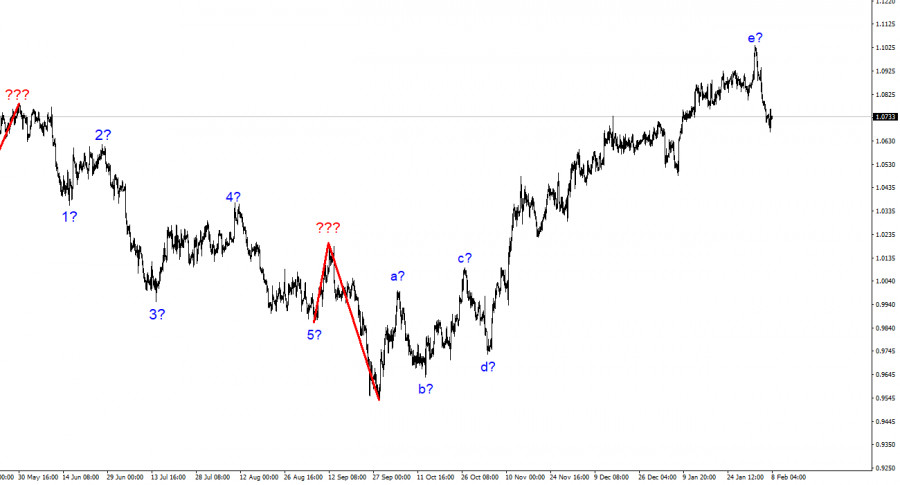
On higher time frames, the wave layout of the ascending section of the trend is getting longer and may already be completed. We have identified five ascending waves that most likely make up the a-b-c-d-e pattern. The pair may already have started the formation of a descending section so it can decline by another 300-400 pips.

Chin Zhao,
InstaForex के विश्लेषणात्मक विशेषज्ञ
© 2007-2025
समय सीमा चुनें
5
मिनट
15
मिनट
30
मिनट
1
घंटा
4
घंटे
1
दिन
1
सप्ताह
Earn on cryptocurrency rate changes with InstaForex
Download MetaTrader 4 and open your first trade
  • Grand Choice
    Contest by
    InstaForex
    InstaForex always strives to help you
    fulfill your biggest dreams.
    कॉन्टेस्ट में हिस्सा लें

अनुशंसित लेख

20 मई, 2025 को GBP/USD का विश्लेषण

GBP/USD के लिए वेव पैटर्न डोनाल्ड ट्रम्प के कारण एक बुलिश इम्पल्सिव वेव स्ट्रक्चर के बनने का संकेत देता रहा है। यह वेव पिक्चर लगभग EUR/USD जोड़ी जैसा ही है।

Chin Zhao 13:36 2025-05-21 UTC+2

EUR/USD, USD/JPY, GBP/JPY, USD/CAD, NZD/USD और गोल्ड के लिए सरल वेव विश्लेषण पर आधारित साप्ताहिक पूर्वानुमान – 21 अप्रैल

EUR/USD विश्लेषण: फरवरी से, EUR/USD एक ऊपर की ओर वेव बना रहा है, जिसकी अंतिम अवस्था (C) वर्तमान में चल रही है। हाल ही में इस जोड़ी ने एक मजबूत

Isabel Clark 11:13 2025-04-21 UTC+2

EUR/USD, USD/JPY, GBP/JPY, USD/CAD, #Bitcoin, और #Ripple के लिए सरलीकृत तरंग विश्लेषण पर आधारित साप्ताहिक पूर्वानुमान - 31 मार्च

आने वाले दिनों में यूरो विनिमय दर में गिरावट का दौर पूरा होने की संभावना है, जो संभावित रूप से गणना किए गए समर्थन क्षेत्र की निचली सीमा तक पहुंच

Isabel Clark 19:17 2025-03-31 UTC+2

20 मार्च 2025 को EUR/USD का विश्लेषण

EUR/USD के 4-घंटे चार्ट पर वेव संरचना एक अधिक जटिल रूप में बदलने के जोखिम में है। 25 सितंबर को एक नया डाउनट्रेंड संरचना बननी शुरू हुई, जो एक इम्पल्स

Chin Zhao 08:05 2025-03-21 UTC+2

10 मार्च को EUR/USD, USD/JPY, GBP/JPY, USD/CAD, GOLD और बिटकॉइन के लिए सरलीकृत तरंग विश्लेषण पर आधारित साप्ताहिक पूर्वानुमान

विश्लेषण: फरवरी की शुरुआत से ही, यूरो एक ऊपर की ओर टेढ़ी-मेढ़ी लहर बना रहा है, जो एक नए तेजी के रुझान की शुरुआत को दर्शाता है। यह जोड़ी साप्ताहिक

Isabel Clark 10:15 2025-03-10 UTC+2

10 मार्च को GBP/USD, AUD/USD, USD/CHF, EUR/JPY, Ethereum, और Litecoin के लिए साप्ताहिक पूर्वानुमान बेससिम्प्लीफाइड वेव विश्लेषण

विश्लेषण: 13 जनवरी को शुरू हुई ऊपर की लहर अभी भी अधूरी है, जो प्रमुख वैश्विक अपट्रेंड का एक नया खंड बनाती है। यह जोड़ी वर्तमान में समर्थन और प्रतिरोध

Isabel Clark 10:12 2025-03-10 UTC+2

सरलीकृत तरंग विश्लेषण पर आधारित साप्ताहिक पूर्वानुमान: GBP/USD, AUD/USD, USD/CHF, EUR/JPY, एथेरियम, लिटकोइन - 24 फ़रवरी

पिछले छह महीनों में, GBP/USD में गिरावट का रुख रहा है। जनवरी के मध्य से, कीमत एक मजबूत समर्थन क्षेत्र से उलटफेर की संभावना के साथ एक काउंटर-वेव बना रही

Isabel Clark 18:23 2025-02-24 UTC+2

GBP/USD विश्लेषण – 11 फरवरी: बाजार बैली से बहुत उम्मीदें लगाए हुए है

GBP/USD विश्लेषण – 11 फरवरी: GBP/USD की लहर संरचना कुछ हद तक अस्पष्ट है लेकिन सामान्यत: समझने योग्य है। उच्च संभावना है कि एक दीर्घकालिक मंदी प्रवृत्ति का खंड अभी

Chin Zhao 06:33 2025-02-12 UTC+2

GBP/USD, AUD/USD, USD/CHF, EUR/JPY, यूएस डॉलर इंडेक्स और एथेरियम के लिए सरलीकृत तरंग विश्लेषण पर आधारित साप्ताहिक पूर्वानुमान – 3 फरवरी

ब्रिटिश पाउंड के लिए प्रमुख मंदी की लहर, जो पिछले साल अगस्त में शुरू हुई थी, दो सप्ताह पहले शुरू हुए सुधारात्मक, बदलते फ्लैट पैटर्न के माध्यम से विकसित होना

Isabel Clark 18:00 2025-02-03 UTC+2

EUR/USD, USD/JPY, GBP/JPY, USD/CAD, NZD/USD, और बिटकॉइन के लिए सरलीकृत तरंग विश्लेषण पर आधारित साप्ताहिक पूर्वानुमान – 3 फरवरी

विश्लेषण: पिछले साल अक्टूबर से, यूरो की कीमत में उतार-चढ़ाव की लहर चल रही है। साल की शुरुआत से ही एक काउंटर-करेक्शन बन रहा है, जो एक विस्तारित फ्लैट पैटर्न

Isabel Clark 17:54 2025-02-03 UTC+2
अभी बात नहीं कर सकते?
अपना प्रश्न पूछें बातचीत.
Widget callback
 

Dear visitor,

Your IP address shows that you are currently located in the USA. If you are a resident of the United States, you are prohibited from using the services of InstaFintech Group including online trading, online transfers, deposit/withdrawal of funds, etc.

If you think you are seeing this message by mistake and your location is not the US, kindly proceed to the website. Otherwise, you must leave the website in order to comply with government restrictions.

Why does your IP address show your location as the USA?

  • - you are using a VPN provided by a hosting company based in the United States;
  • - your IP does not have proper WHOIS records;
  • - an error occurred in the WHOIS geolocation database.

Please confirm whether you are a US resident or not by clicking the relevant button below. If you choose the wrong option, being a US resident, you will not be able to open an account with InstaForex anyway.

We are sorry for any inconvenience caused by this message.