empty
27.03.2023 01:02 PM
Technical analysis of EUR/USD and GBP/USD on March 27

EUR/USD

This image is no longer relevant

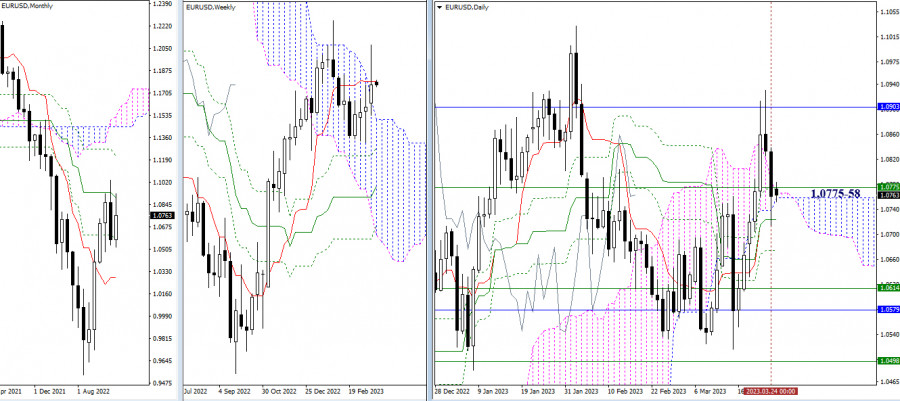
Larger timeframes

Last week, the euro bulls cast a long shadow into the bullish zone relative to an intraday and one-week Ichimoku clouds, having tested 1.09101, the resistance of a one-month medium-term trend. However, they failed to settle at the highs attained. The currency pair closed last trading week lower than the one-week short-term trend line of 1.0775 and returned to the daily cloud. As a result, the support zone is currently clustered between the daily cloud of 1.0758 and the one-week cloud of a short-term trend at 1.0775. Later today, if the bears don't try to terminate the daily Ichimoku cloud, they will have to settle below 1.0724-1.0675, the support area of the cross.

This image is no longer relevant

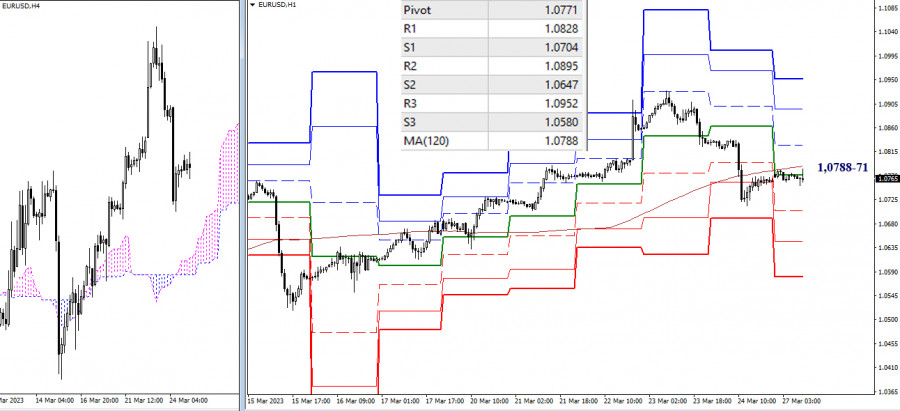
H4 – H1

On smaller time frames, EUR/USD dipped below the critical levels so that the bears are regaining the upper hand in the market. Still, the bears lack the energy to leave the support area. If they manage to drag the price down, the support levels of classic pivot levels (1.0704 – 1.0647 – 1.0580) will serve as the downward intraday targets. If the bulls are able to seize the key level (the central pivot level of 1.0771 + the one-week long-term trend line of 1.0788), the ongoing balance of trading forces will shift in the bulls' favor. The bullish intraday targets could be set at 1.0828 – 1.0895 – 1.0952 which coincide with resistance levels of classic pivot levels.

***

GBP/USD

This image is no longer relevant

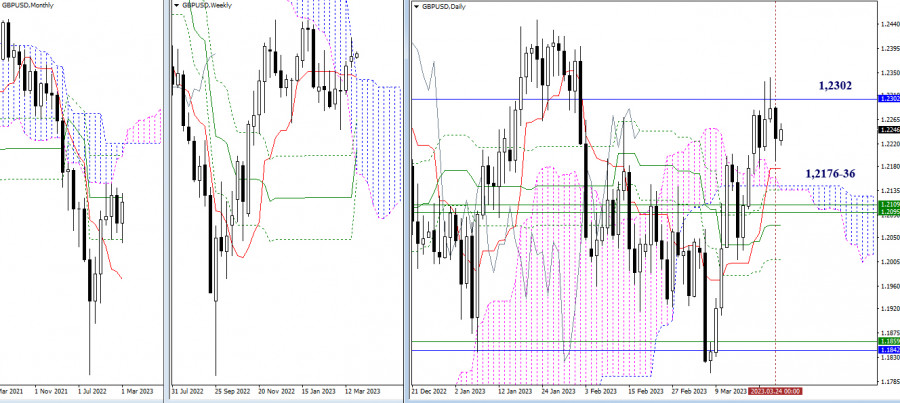
Larger timeframes

Last week, GBP/USD tested the one-month medium-term trend line at 1.2302. The price didn't break this level or at least, didn't close higher. Therefore, this level remains the basic resistance of this section. The next target for the bulls is seen at a higher level than a one-year high of 1.2447. The support zone is still wide and secured. It can be divided into three main areas: 1.2176 – 1.2136 (the daily cloud + levels of the daily cross), 1.2109 – 1.2095 – 1.2072 (one-week levels + daily medium-tern trend), and 1.2008 (the final level of the daily Ichimoku cross).

This image is no longer relevant

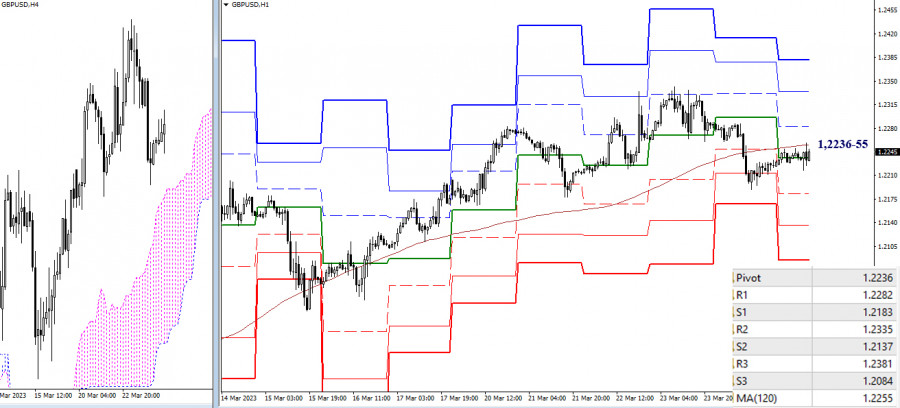
H4 – H1

At the moment of analysis, the outlook for GBP/USD is uncertain. The instrument is connected to the zone of key levels which are combined today at 1.2236-55 (the central pivot level + one-week long-term trend line). Later on the trading day, the classic pivot levels will come into play because the bulls are interested in resistance levels of 1.2282 – 1.2335 – 1.2381, whereas the bears are interested in support levels of 1.2183 – 1.2137 – 1.2084.

***

This technical analysis is based on the following ideas:

Larger timeframes - Ichimoku Kinko Hyo (9.26.52) + Fibo Kijun levels

Smaller timeframes - H1 – classic pivot points + 120-period Moving Average (weekly long-term trend line)

Evangelos Poulakis,
InstaForex के विश्लेषणात्मक विशेषज्ञ
© 2007-2025
समय सीमा चुनें
5
मिनट
15
मिनट
30
मिनट
1
घंटा
4
घंटे
1
दिन
1
सप्ताह
Earn on cryptocurrency rate changes with InstaForex
Download MetaTrader 4 and open your first trade
  • Grand Choice
    Contest by
    InstaForex
    InstaForex always strives to help you
    fulfill your biggest dreams.
    कॉन्टेस्ट में हिस्सा लें

अनुशंसित लेख

नास्डैक 100 सूचकांक के इंट्राडे मूल्य आंदोलन का तकनीकी विश्लेषण, गुरुवार 12 जून, 2025।

नास्डैक 100 सूचकांक के 4-घंटे के चार्ट पर, इसकी कीमत की चाल और स्टोकेस्टिक ऑस्सीलेटर संकेतक के बीच विसंगति है, खासकर तब जब वर्तमान में #NDX की कीमत EMA (21)

Arief Makmur 14:03 2025-06-12 UTC+2

क्रूड ऑयल कमोडिटी इंस्ट्रूमेंट की दैनिक मूल्य चाल का तकनीकी विश्लेषण, गुरुवार 12 जून, 2025।

अगर हम क्रूड ऑयल कमोडिटी इंस्ट्रूमेंट के दैनिक चार्ट को देखें, तो #CL की मूल्य चाल और स्टोकास्टिक ऑस्सीलेटर इंडिकेटर के बीच एक विचलन दिखाई देता है, जो इस बात

Arief Makmur 13:57 2025-06-12 UTC+2

गोल्ड (XAU/USD) के लिए 11-14 जून 2025 के ट्रेडिंग सिग्नल: $3,340 (21 SMA - 7/8 मरे) के नीचे बेचें।

अगर सोना डाउनट्रेंड चैनल को तोड़कर 3,340 के ऊपर स्थिर होता है, तो इसका परिदृश्य बुलिश हो सकता है। इस स्थिति में धातु 3,359, 3,390 और यहां तक कि मरे

Dimitrios Zappas 08:09 2025-06-11 UTC+2

BITCOIN (BTC/USD) के लिए 11 से 13 जून तक ट्रेडिंग सिग्नल: $110,700 (21 SMA - 200 EMA) के नीचे बेचें।

बिटकॉइन वर्तमान में लगभग 110,726 के आसपास ट्रेड कर रहा है, और मई के अंत में देखे गए स्तर 110,726 तक पहुंचने के बाद तकनीकी सुधार की प्रक्रिया में है।

Dimitrios Zappas 08:03 2025-06-11 UTC+2

GBP/JPY क्रॉस करेंसी पेयर्स के इंट्राडे प्राइस मूवमेंट का तकनीकी विश्लेषण, मंगलवार 10 जून, 2025।

GBP/JPY क्रॉस करेंसी पेयर के 4-घंटे के चार्ट पर कई दिलचस्प बातें देखी जा सकती हैं। पहली बात यह है कि प्राइस मूवमेंट WMA (21) के ऊपर चल रहा है

Arief Makmur 07:57 2025-06-10 UTC+2

EUR/USD मुख्य मुद्रा जोड़ी की इंट्राडे कीमत गति का तकनीकी विश्लेषण, मंगलवार 10 जून 2025।

Ascending Broadening Wedge पैटर्न के प्रकट होने के बाद Bearish 123 पैटर्न के दिखने से यह संकेत मिलता है कि निकट भविष्य में EUR/USD कमजोर हो सकता है, खासकर

Arief Makmur 07:55 2025-06-10 UTC+2

EUR/USD पूर्वानुमान – 9 जून, 2025 के लिए

मध्यम रूप से आशावादी अमेरिकी रोज़गार डेटा ने डॉलर को पुनर्जीवित किया, जिससे इसमें 0.44% की बढ़त हुई। यूरो 50 पिप्स गिर गया। स्टॉक मार्केट के साथ एक विचलन (डाइवर्जेंस)

Laurie Bailey 12:09 2025-06-09 UTC+2

USD/JPY का पूर्वानुमान, 9 जून 2025

पिछले येन विश्लेषण में हमने उल्लेख किया था कि 145.08 स्तर मुख्य लक्ष्य 146.11 के लिए एक मध्यवर्ती बाधा के रूप में काम करता है। हालांकि, आज सुबह तक, बुल्स

Laurie Bailey 07:36 2025-06-09 UTC+2

GBP/USD की भविष्यवाणी — 9 जून, 2025

शुक्रवार को, जब अमेरिकी डॉलर सूचकांक 0.44% मजबूत हुआ, तो ब्रिटिश पाउंड 42 पिप्स गिर गया। हालांकि, मार्लिन ऑस्सीलेटर स्थिर बना हुआ है, जो नीचे से शून्य रेखा द्वारा समर्थित

Laurie Bailey 07:34 2025-06-09 UTC+2

6 जून, 2025 के लिए EUR/USD का पूर्वानुमान

कल, उम्मीद के मुताबिक, यूरोपीय सेंट्रल बैंक (ECB) ने मुख्य ब्याज दरों में चौथाई अंक की कटौती की, जिससे रीफाइनेंसिंग रेट 2.15% हो गया। प्रेस कॉन्फ्रेंस में, ECB की अध्यक्ष

Laurie Bailey 12:04 2025-06-06 UTC+2
अभी बात नहीं कर सकते?
अपना प्रश्न पूछें बातचीत.
Widget callback
 

Dear visitor,

Your IP address shows that you are currently located in the USA. If you are a resident of the United States, you are prohibited from using the services of InstaFintech Group including online trading, online transfers, deposit/withdrawal of funds, etc.

If you think you are seeing this message by mistake and your location is not the US, kindly proceed to the website. Otherwise, you must leave the website in order to comply with government restrictions.

Why does your IP address show your location as the USA?

  • - you are using a VPN provided by a hosting company based in the United States;
  • - your IP does not have proper WHOIS records;
  • - an error occurred in the WHOIS geolocation database.

Please confirm whether you are a US resident or not by clicking the relevant button below. If you choose the wrong option, being a US resident, you will not be able to open an account with InstaForex anyway.

We are sorry for any inconvenience caused by this message.