Analyzing Friday's trades:
EUR/USD on 30M chart
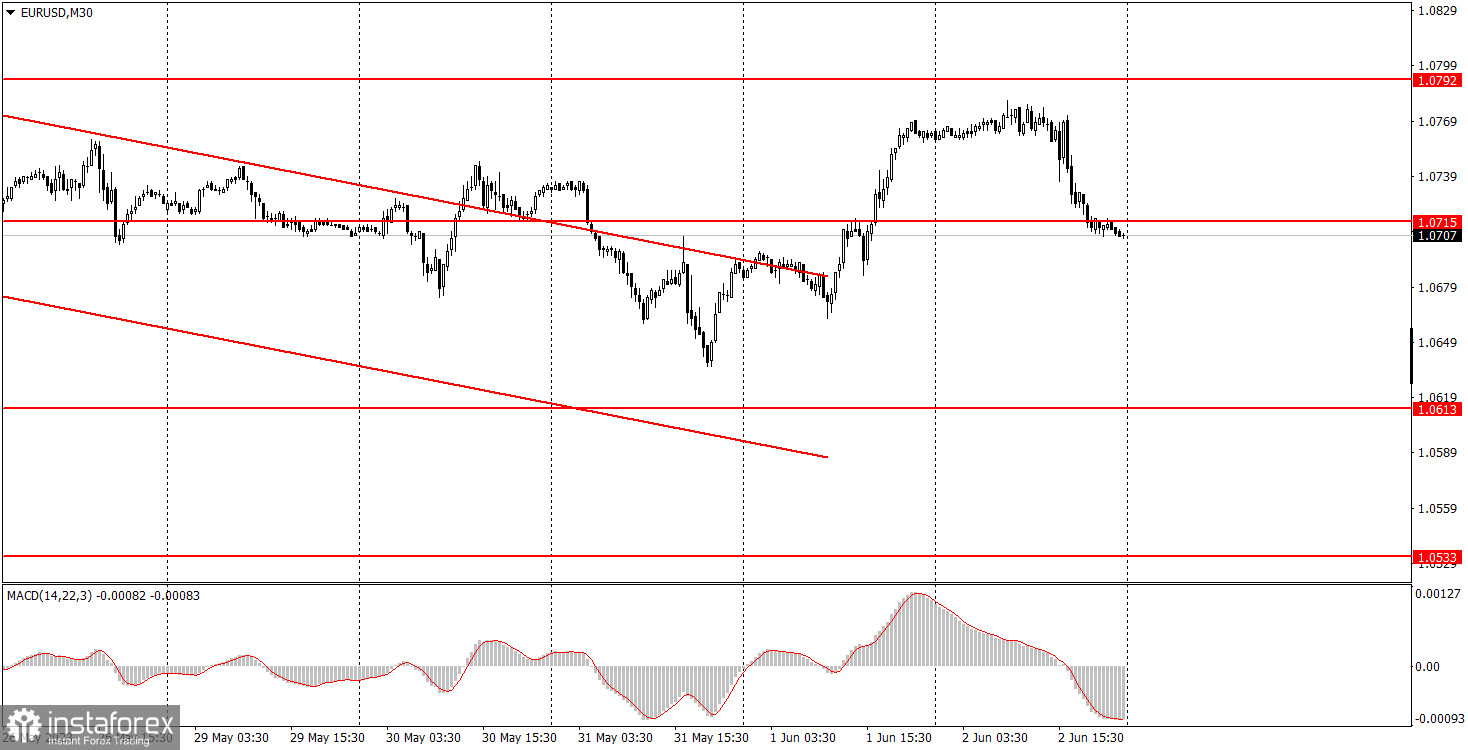
The EUR/USD pair came under pressure on Friday, which was in line with the macroeconomic background. Even the nature of the pair's movements throughout the day reflects the timing and impact of news releases. In the first half of the day, there was no data or events, and the pair remained stagnant. In the second half of the day, the US released important data, leading to high volatility and a logical direction for the pair. Therefore, there are no questions regarding Friday's performance. After a two-day rally, the pair corrected downwards, and the downtrend may resume since the euro has no reason to appreciate in value.
On Friday, the US released labor market and unemployment data, which contradicted each other. The unemployment rate increased from 3.4% to 3.7%, surpassing forecasts, while the Nonfarm Payrolls figure also exceeded expectations by 150,000. However, in our fundamental analysis over the weekend, we explained why the Nonfarm Payrolls report is more important than the unemployment report.
EUR/USD on 5M chart
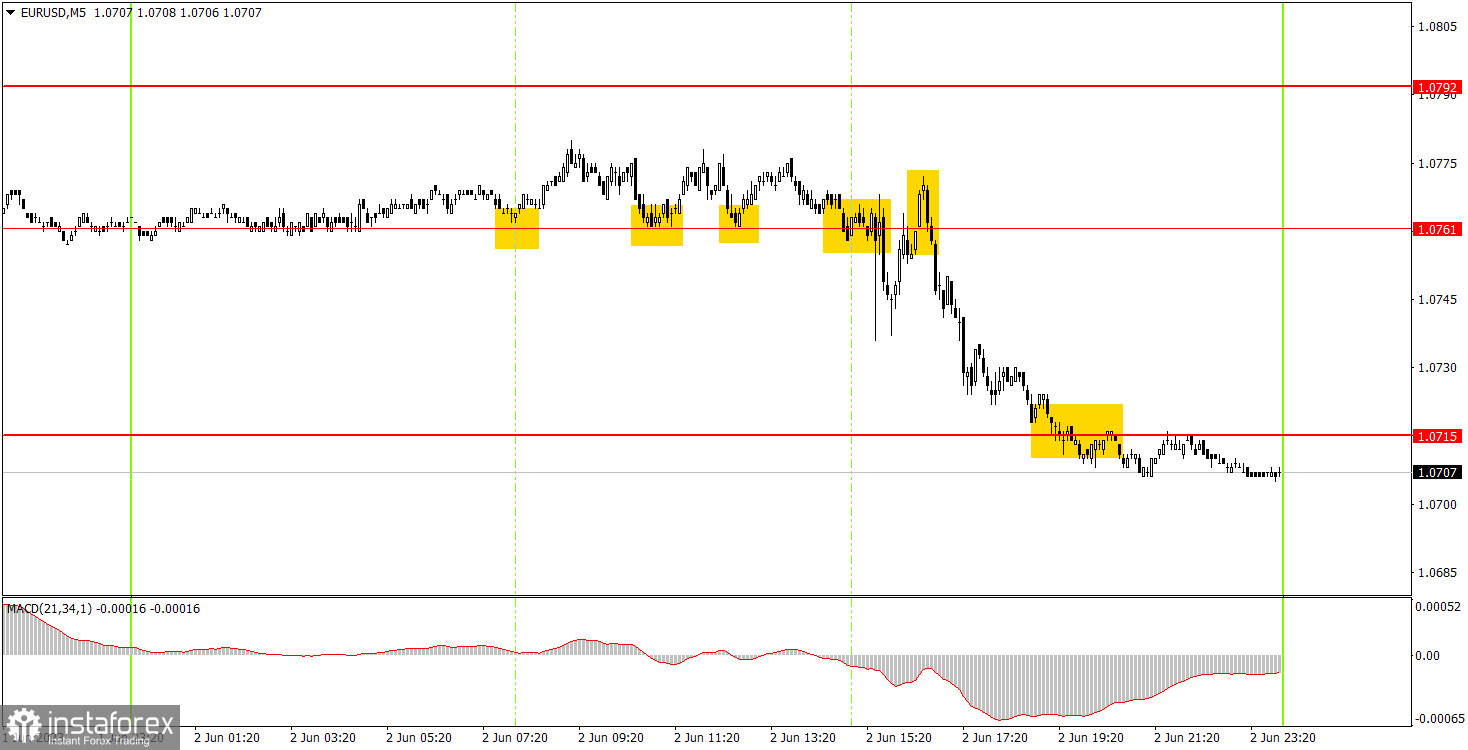
The 5-minute chart showed that the pair remained flat during the European trading session and moved downwards during the US session. During the European session, the pair rebounded from 1.0761 thrice, and beginners could open long positions that should have been manually closed before the release of US data. The trade closed almost breakeven. Later, a selling signal was formed near the same level of 1.0761, but it occurred precisely during the release of the US data. The risk for this short position was high because the market does not always react logically to reports. However, the data favored the US currency, making the shorts relevant. The price almost immediately returned to the level of 1.0761 and rebounded from it, so it was advisable to remain in the shorts. By the end of the day, the pair descended to the level of 1.0715, where the trade should have been closed. The profit amounted to about 35 pips.
Trading tips on Monday:
The 30M chart shows that the pair intends to end the downtrend. The price has left the descending channel, indicating that the euro may temporarily rise, but in the medium-term perspective, we still expect a decline. The key levels on the 5M chart are 1.0517-1.0533, 1.0607-1.0613, 1.0673, 1.0715, 1.0761, 1.0792, 1.0857-1.0867. A stop loss can be set at a breakeven point as soon as the price moves 15 pips in the right direction. On Monday, both the EU and the US will release their respective Services PMIs for May. These reports are not that important, but the US will also release the ISM index for the services sector, which can be considered significant. However, everything will depend on how much the actual value deviates from the forecast. If it is minimal, there may be no significant reaction.
Basic trading rules:
1) The strength of the signal depends on the time period during which the signal was formed (a rebound or a break). The shorter this period, the stronger the signal.
2) If two or more trades were opened at some level following false signals, i.e. those signals that did not lead the price to Take Profit level or the nearest target levels, then any consequent signals near this level should be ignored.
3) During the flat trend, any currency pair may form a lot of false signals or do not produce any signals at all. In any case, the flat trend is not the best condition for trading.
4) Trades are opened in the time period between the beginning of the European session and until the middle of the American one when all deals should be closed manually.
5) We can pay attention to the MACD signals in the 30M time frame only if there is good volatility and a definite trend confirmed by a trend line or a trend channel.
6) If two key levels are too close to each other (about 5-15 pips), then this is a support or resistance area.
How to read charts:
Support and Resistance price levels can serve as targets when buying or selling. You can place Take Profit levels near them.
Red lines are channels or trend lines that display the current trend and show which direction is better to trade.
MACD indicator (14,22,3) is a histogram and a signal line showing when it is better to enter the market when they cross. This indicator is better to be used in combination with trend channels or trend lines.
Important speeches and reports that are always reflected in the economic calendars can greatly influence the movement of a currency pair. Therefore, during such events, it is recommended to trade as carefully as possible or exit the market in order to avoid a sharp price reversal against the previous movement.
Beginners should remember that every trade cannot be profitable. The development of a reliable strategy and money management are the key to success in trading over a long period of time.