Bitcoin continues to lose its value and worth. "Digital gold" is now much closer to resuming its decline than starting a noticeable correction. The only pattern that could theoretically support a corrective movement is the bullish IFVG on the 4-hour time frame. However, after several days, we have not seen any reaction to this pattern. Therefore, we no longer consider this pattern relevant and remind traders that attempting to trade corrections in a strong downward trend is not advisable.
At this moment, there are no signs of potential growth for BTC on either the daily or the 4-hour chart. The market has not reacted to U.S. labor market and unemployment data, but the broader fundamentals have not influenced the cryptocurrency market for quite some time. In our view, the current decline in Bitcoin, which has been ongoing for 5 months, is very simple to explain. The upward trend lasted for a full 3 years, during which Bitcoin rose from $15,000 to $126,000. The trend has ended, and the opposite one has begun. Why did no experts call for sales in 2022-2025? Why is every second expert calling for buys now? These are rhetorical questions.
The crypto community remains divided among traders, investors, companies, and interested parties. Traders see a downward trend; investors flee to safe assets amid overall political instability in the U.S. and geopolitical uncertainty; companies are losing money and investors are losing interest; and interested parties watch their capital shrink. Therefore, it is not surprising that the last two categories of "experts" continue to insist that Bitcoin "will establish a new ATH this year."
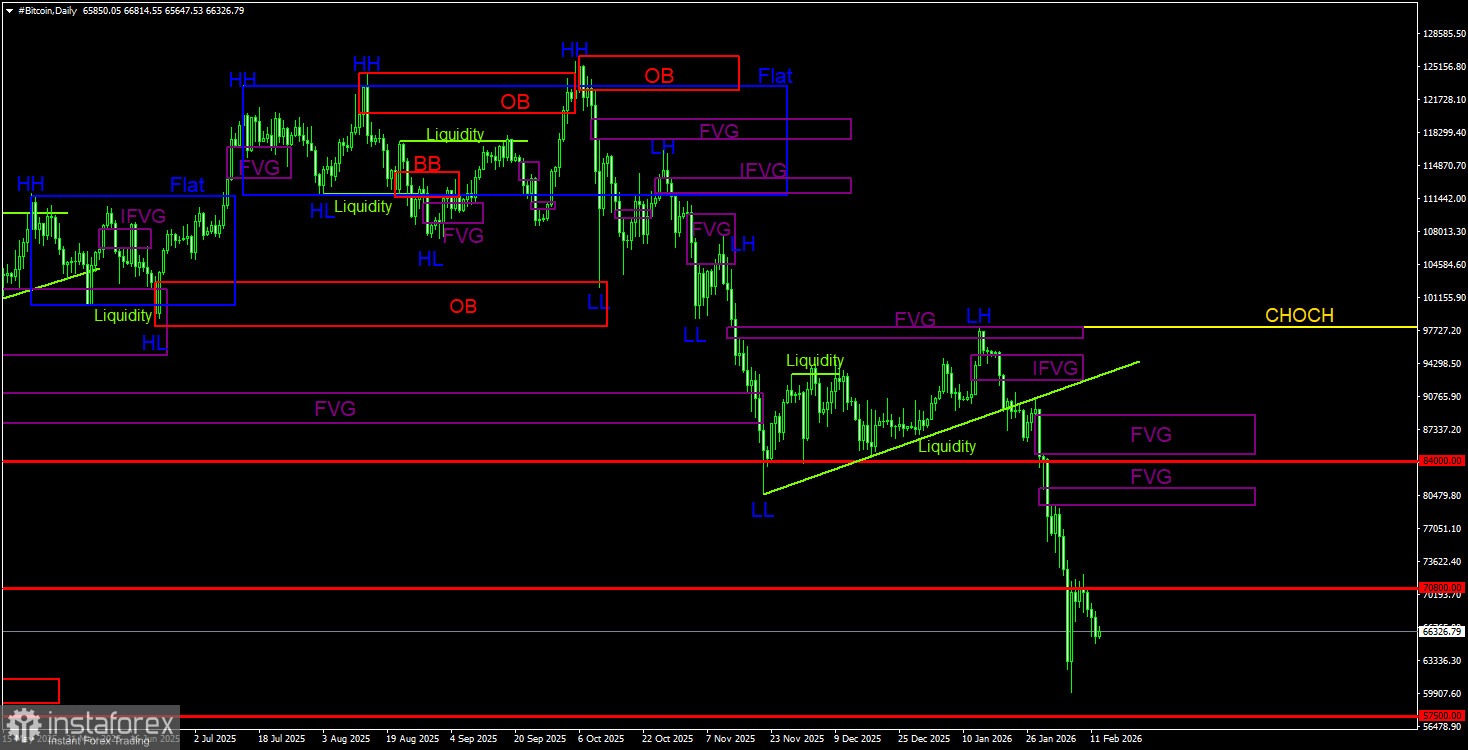
Overall Picture of BTC/USD on the 1D
On the daily time frame, Bitcoin continues to form a downward trend. The trend structure is identified as bearish, and the CHOCH line currently passes at the level of $97,900. Only above this level can it be considered that the downward trend has ended. Recall that the sell signal was formed within the bearish FVG ($96,900 - $98,000) and received confirmation on a smaller time frame. Thus, traders had an excellent opportunity to take almost all of the recent downward movement. The current target remains the level of $57,500 – the 61.8% Fibonacci level. Given the lack of signs of a reversal, we believe the decline will continue. On the daily time frame, the nearest POI area for new sell trades is in the range of $79,500–$81,100, but Bitcoin still needs to reach it.
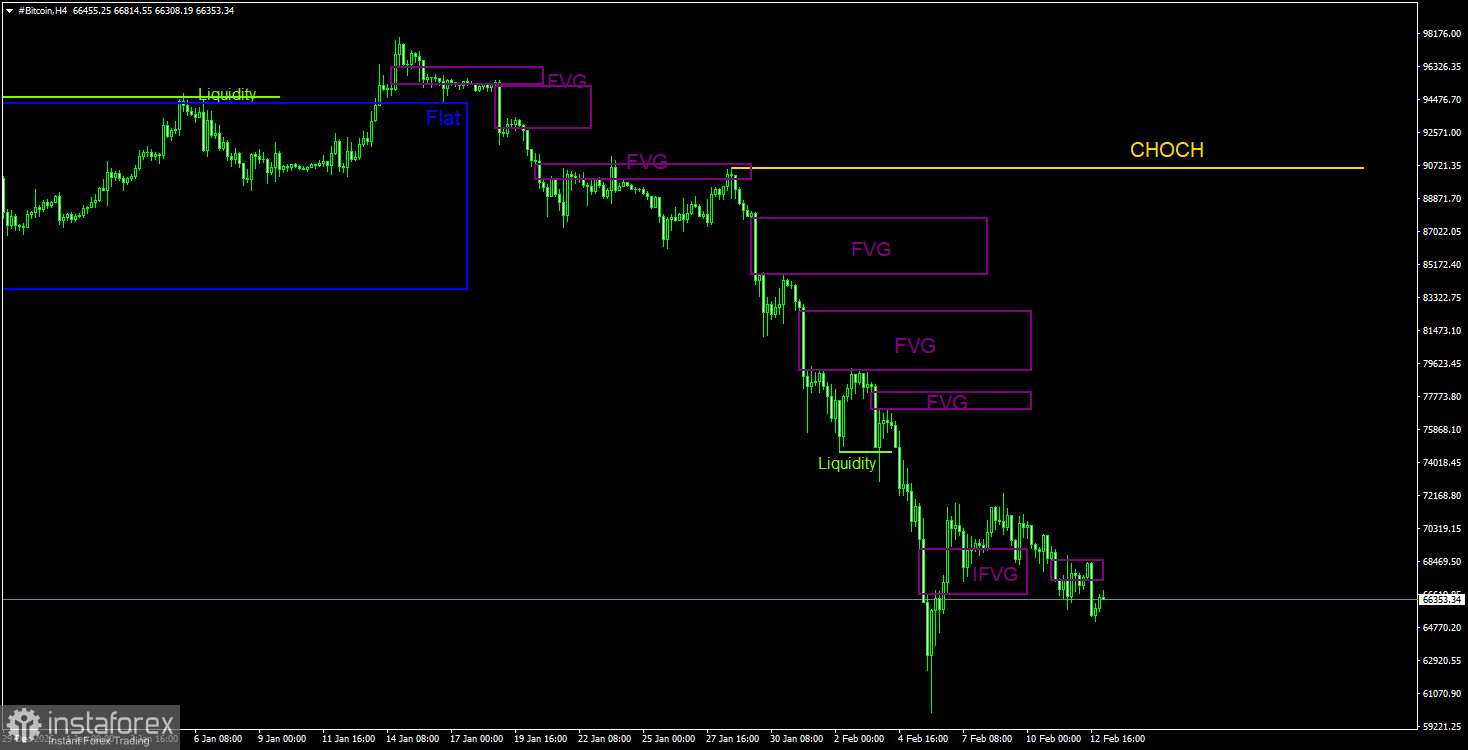
Overall Picture of BTC/USD on the 4H
On the 4-hour time frame, the price is also continuing to form a downward structure. The CHOCH line passes at $90,560; only above that level can we speak of transforming the trend into an upward one. However, at this moment, there are no signs that Bitcoin may complete its decline in the near future. Even the bullish IFVG pattern failed to elicit a significant reaction. Meanwhile, a small bearish FVG formed this week, and the price reacted to it; it is currently continuing its decline.
Recommendations for Trading BTC/USD:
Bitcoin continues to form a full-fledged downward trend. We continue to expect a drop to the target of $57,500 (61.8% Fibonacci level from a three-year upward trend), and there are currently no signs of a trend reversal. However, even the level of $57,500 no longer looks like a final stop. Among the POI areas for sales on the daily time frame, the last bearish FVG can be highlighted, which Bitcoin is still very far from reaching. On the 4-hour time frame, there is also a bearish FVG that reacted yesterday. It may now be too late to open new short positions, but we reiterate: there are no signs of a reversal.
Explanations for Illustrations:
- CHOCH – break in the trend structure.
- Liquidity – liquidity, stop loss of traders that market makers use to build their positions.
- FVG – area of price inefficiency. Prices pass through such areas very quickly, indicating a complete absence of one side in the market. Subsequently, prices tend to return to and react to such areas.
- IFVG – inverted area of price inefficiency. After returning to such an area, the price does not react to it; instead, it impulsively breaks through and then tests it from the other side.
- OB – order block. The candle on which the market maker opened a position aimed at collecting liquidity to form their own position in the opposite direction.