Forecast for July 8:
Analytical review of H1-scale currency pairs:
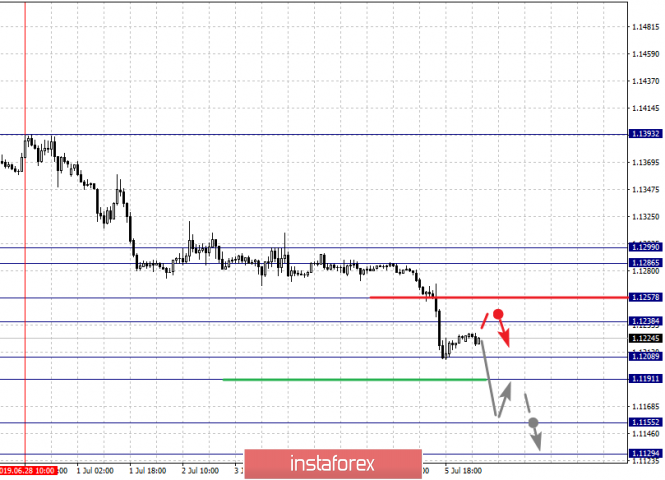
For the euro / dollar pair, the key levels on the H1 scale are: 1.1299, 1.1286, 1.1257, 1.1238, 1.1208, 1.1191, 1.1155 and 1.1129. Here, we continue to monitor the downward structure of June 28. Short-term downward movement is expected in the range of 1.1208 - 1.1191. The breakdown of the last value should be accompanied by a pronounced downward movement. Here, the goal is 1.1155. We consider the level of 1.1129 to be a potential value for the bottom. After reaching this level, we expect a rollback to the top.
Short-term upward movement is possible in the range of 1.1238 - 1.1257. The breakdown of the latter value will lead to in-depth correction. Here, the goal is 1.1286. The range of 1.1286 - 1.1299 is a key support for the downward structure.
The main trend - a local downward structure of June 28.
Trading recommendations:
Buy 1.1238 Take profit: 1.1255
Buy 1.1258 Take profit: 1.1285
Sell: 1.1208 Take profit: 1.1192
Sell: 1.1189 Take profit: 1.1155
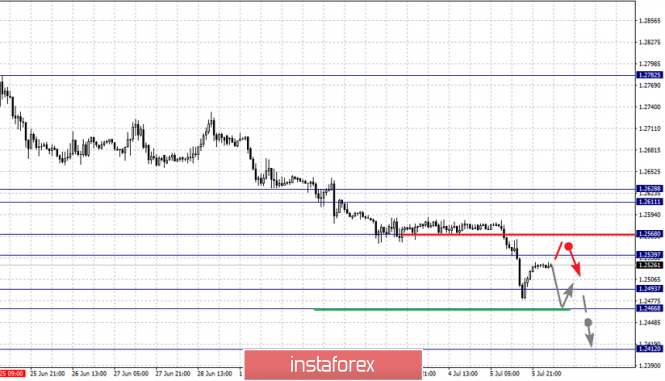
For the pound / dollar pair, the key levels on the H1 scale are: 1.2628, 1.2611, 1.2568, 1.2539, 1.2493, 1.2466 and 1.2412. Here, we are following the development of the downward structure of June 25th. Short-term downward movement is expected in the range of 1.2493 - 1.2466. For the potential value for the bottom, we consider the level of 1.2412. The movement to which is expected after the breakdown of the level of 1.2465.
Short-term upward trend is expected in the range of 1.2539 - 1.2568. The breakdown of the last value will lead to a prolonged correction. Here, the target is 1.2611. The range of 1.2611 - 1.2628 is a key support for the downward structure from which, we expect clearance of the expressed initial conditions for the upward cycle.
The main trend - the downward structure of June 25.
Trading recommendations:
Buy: 1.2540 Take profit: 1.2566
Buy: 1.2570 Take profit: 1.2610
Sell: 1.2493 Take profit: 1.2467
Sell: 1.2464 Take profit: 1.2419
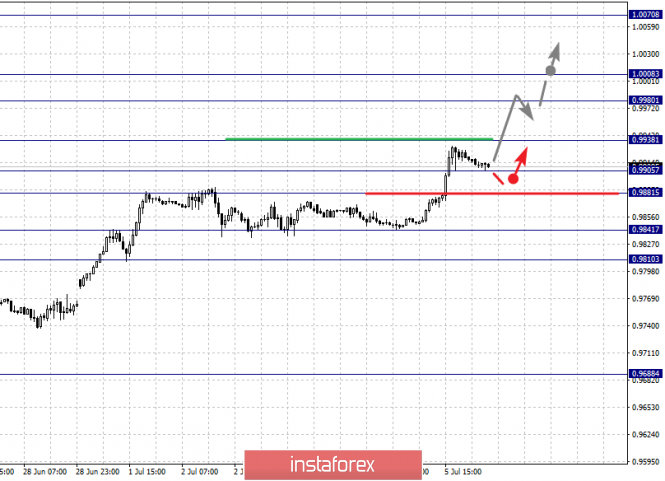
For the dollar / franc pair, the key levels on the H1 scale are: 1.0070, 1.0008, 0.9980, 0.9938, 0.9905, 0.9881, 0.9841 and 0.9810. Here, we continue to follow the development of the ascending cycle of June 25. The continuation of the movement to the top is expected after the breakdown of the level of 0.9938. In this case, the goal is 0.9980. Price consolidation is in the range of 0.9980 - 1.0008 and hence, there is a high probability of going into a correction. For the potential value for the top, we consider the level of 1.0070.
Short-term downward movement is possible in the range of 0.9905 - 0.9881. The breakdown of the last value will lead to a prolonged correction. Here, the target is 0.9841. This level is a key support for the top. Its price will have the formation of the initial conditions for the downward cycle of 0.9810.
The main trend is the ascending cycle of June 25.
Trading recommendations:
Buy : 0.9939 Take profit: 0.9980
Buy : 0.9982 Take profit: 1.0008
Sell: 0.9905 Take profit: 0.9883
Sell: 0.9878 Take profit: 0.9844
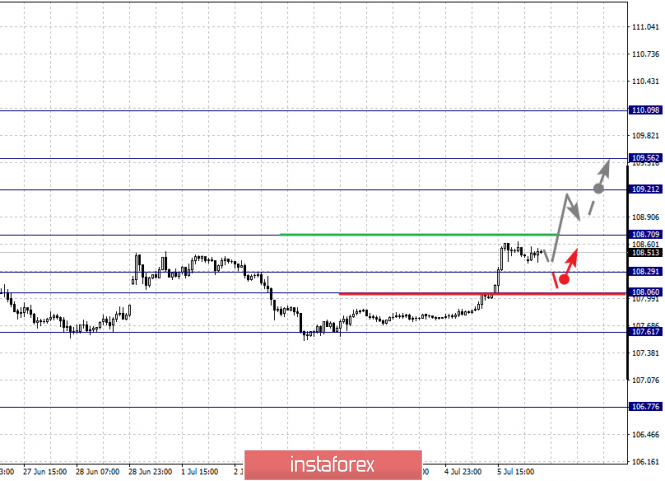
For the dollar / yen pair, the key levels on the scale are : 110.09, 109.56, 109.21, 108.70, 108.29, 108.06 and 107.61. Here, we continue to follow the development of the ascending structure of June 25. The continuation of the movement to the top is expected after the breakdown of the level of 108.70. In this case, we expect a pronounced movement to the level of 109.21. Short-term upward movement, as well as consolidation is in the range of 109.21 - 109.56. For the potential value for the top, we consider the level of 110.09. The movement to which, is expected after the breakdown of the level of 109.56.
Short-term downward movement is possible in the range of 108.29 - 108.06. The breakdown of the last value will lead to a prolonged correction. Here, the target is 107.61. This level is a key support for the top.
The main trend: the ascending structure of June 25.
Trading recommendations:
Buy: 108.70 Take profit: 109.20
Buy : 109.23 Take profit: 109.53
Sell: 108.29 Take profit: 108.06
Sell: 108.03 Take profit: 107.65
For the Canadian dollar / US dollar pair, the key levels on the H1 scale are: 1.3272, 1.3238, 1.3212, 1.3174, 1.3142, 1.3051, 1.3027 and 1.3001. Here, the price forms the potential for an upward movement of July 4th. The continuation of the movement to the top is expected after the breakdown of the level of 1.3142. In this case, the target is 1.3174, wherein consolidation is near this level. The breakdown of the level of 1.3175 will lead to a pronounced movement. Here, the target is 1.3212. A short-term upward movement, as well as consolidation is in the range of 1.3212 - 1.3238. For the potential value for the top, we consider the level of 1.3272. After reaching which, we expect a rollback to the bottom.
The level of 1.3051 is a key support for the ascending structure. Its breakdown will lead to movement to level 1.3027. For the potential value for the bottom, we consider the level of 1.3001.
The main trend is the formation of potential for the upward trend of July 4.
Trading recommendations:
Buy: 1.3142 Take profit: 1.3172
Buy : 1.3176 Take profit: 1.3212
Sell: 1.3050 Take profit: 1.3028
Sell: 1.3025 Take profit: 1.3001
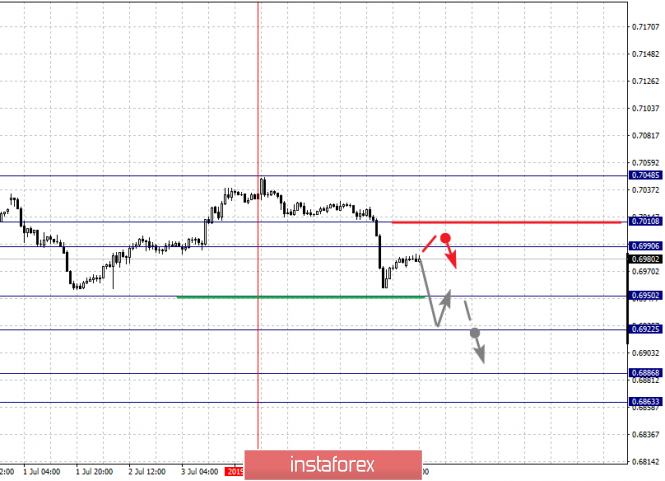
For the pair Australian dollar / US dollar, the key levels on the H1 scale are : 0.7048, 0.7010, 0.6990, 0.6950, 0.6922, 0.6886 and 0.6863. Here, the price forms the potential for the downward cycle of July 4th. The continuation of the movement to the bottom is expected after the breakdown of the level of 0.6950. In this case, the target is 0.6922, wherein near this level is a price consolidation. The breakdown of the level of 0.6921 will lead to the development of a pronounced movement. Here, the target is 0.6886. For the potential value for the downward trend, we consider the level of 0.6863. After reaching which, we expect consolidation, as well as a rollback to the top.
Short-term upward movement is possible in the range of 0.6990 - 0.7010. The breakdown of the latter value will have to form an upward structure. Here, the potential target is 0.7048.
The main trend - the formation of the potential for the downward movement of July 4.
Trading recommendations:
Buy: 0.6990 Take profit: 0.7008
Buy: 0.7013 Take profit: 0.7045
Sell : 0.6950 Take profit : 0.6925
Sell: 0.6920 Take profit: 0.6888
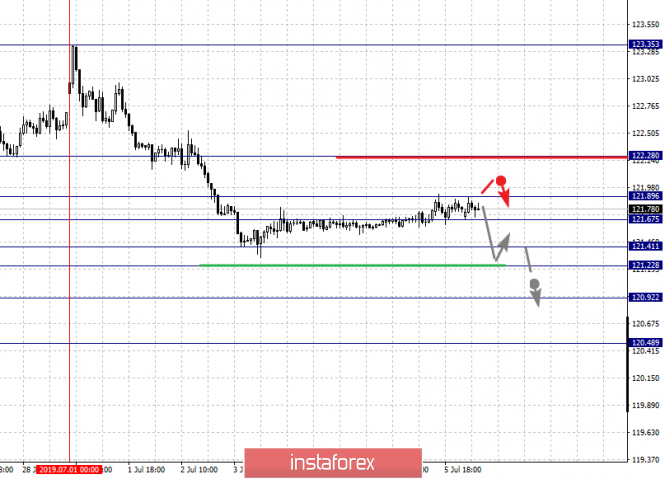
For the euro / yen pair, the key levels on the H1 scale are: 122.28, 121.89, 121.67, 121.41, 121.22, 120.92 and 120.48. Here, we continue to follow the downward cycle of July 1. The continuation of the movement to the bottom is expected after the price passes by the noise range of 121.41 - 121.22. In this case, the target is 120.92, wherein near this level, there is consolidation. For the potential value for the bottom, we consider the level of 120.48. After reaching which, we expect a rollback to the top.
Consolidated movement is possible in the range of 121.67 - 121.89. The breakdown of the latter value will lead to a prolonged correction. Here, the goal is 122.28. This level is a key support for the downward structure.
The main trend is the downward cycle of July 1.
Trading recommendations:
Buy: Take profit:
Buy: 121.94 Take profit: 122.28
Sell: 121.22 Take profit: 120.94
Sell: 120.90 Take profit: 120.50
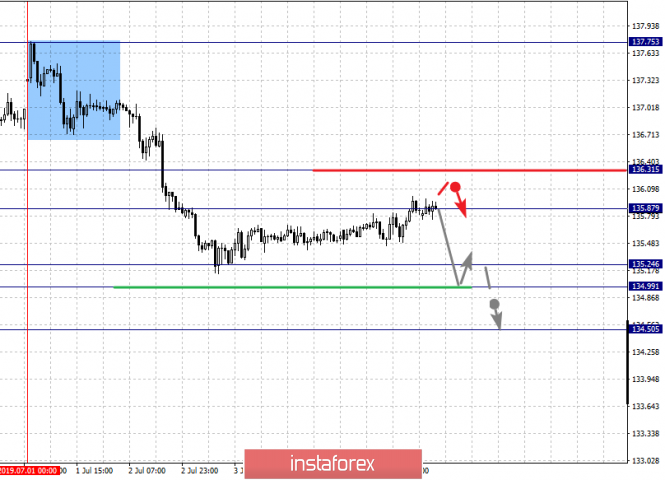
For the pound / yen pair, the key levels on the H1 scale are : 136.31, 135.87, 135.65, 135.24, 134.99 and 134.50. Here, we continue to monitor the downward cycle from July 1. At the moment, the price is in the correction zone. Short-term downward movement is expected in the range of 135.24 - 134.99. The breakdown of the last value will allow us to expect movement towards a potential target - 134.50. After reaching this level, we expect a rollback to the top.
Short-term upward movement is possible in the range of 135.87 - 136.31, and up to the level of 136.31, we expect the potential for the upward cycle to be formalized.
The main trend is the downward cycle of July 1, the stage of correction.
Trading recommendations:
Buy: 135.90 Take profit: 136.30
Sell: 135.24 Take profit: 135.00
Sell: 134.95 Take profit: 134.50