Analysis of Trades and Trading Tips for the Japanese Yen
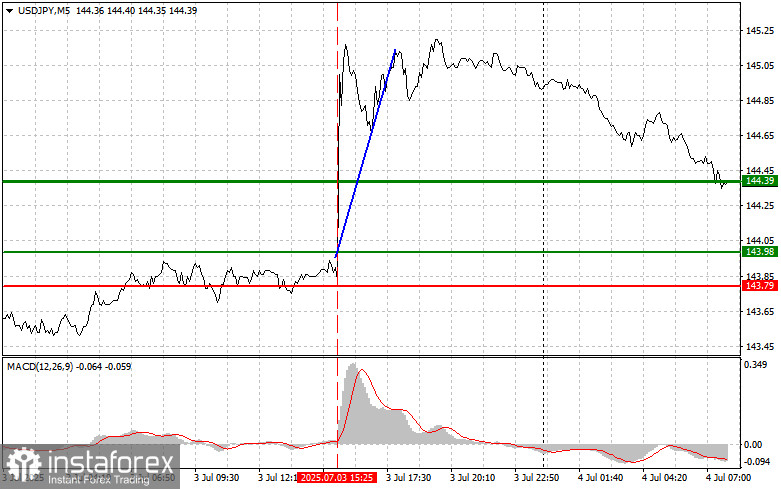
The test of the 143.98 level occurred when the MACD indicator had already moved significantly above the zero line, which should have limited the dollar's upside potential. However, considering the strong U.S. labor market data that defied economists' forecasts, it was reasonable to buy the dollar and expect further upward movement in the USD/JPY pair, which I did. As a result, the pair rose by over 100 pips.
A drop in the U.S. unemployment rate to 4.1% and an increase in nonfarm payrolls by 147,000, exceeding economists' expectations, served as a catalyst for USD/JPY growth. The improvement in U.S. macroeconomic indicators strengthens the dollar's position as an attractive asset for yield-seeking investors. Expectations of a more hawkish monetary policy from the Federal Reserve also support demand for the U.S. currency. Overall, the current market situation indicates continued upward potential for USD/JPY. However, investors should exercise caution and consider all factors affecting exchange rate dynamics when making investment decisions.
Today, during the Asian session, strong data on household spending in Japan were released, exceeding economists' forecasts. This led to a decline in the value of the dollar and a rise in the value of the Japanese yen. The improvement in consumer activity in Japan indicates a recovery in domestic demand, which is a crucial factor for sustainable economic growth. The rise in household spending may be attributed to several factors, including wage growth, lower unemployment rates, and increased consumer confidence. The market reaction was quite predictable: in light of the positive news, investors reassessed their positions in favor of the yen, which strengthened against the dollar despite all the favorable U.S. labor market data released the previous day.
For intraday strategy, I will focus primarily on implementing Scenarios #1 and #2.
Buy Scenario
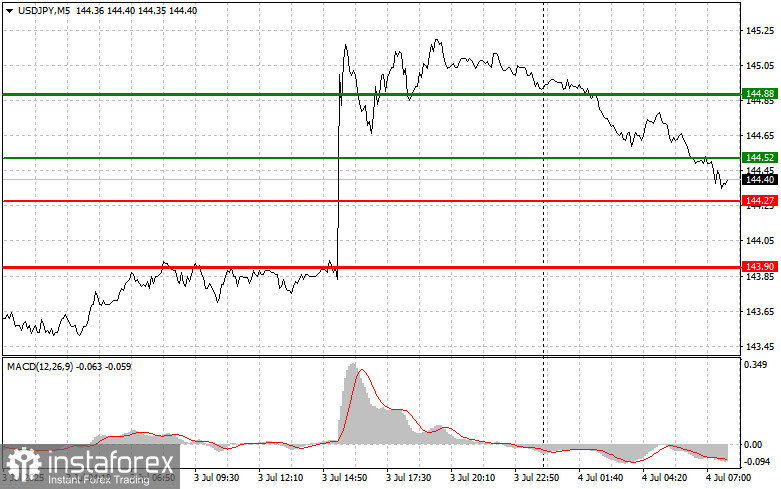
Scenario #1: I plan to buy USD/JPY today upon reaching the entry point around 144.52 (green line on the chart), with a target of rising to 144.88 (thicker green line). Around 144.88, I plan to exit long positions and open shorts in the opposite direction (aiming for a 30–35 pip pullback). It is best to buy the pair during corrections and significant dips in the USD/JPY exchange rate.
Important! Before buying, ensure the MACD indicator is above the zero line and is just starting to rise from it.
Scenario #2: I also plan to buy USD/JPY today in case of two consecutive tests of the 144.27 level when the MACD indicator is in the oversold zone. This will limit the pair's downside potential and trigger an upward reversal. A rise toward the opposite levels of 144.52 and 144.88 can be expected.
Sell Scenario
Scenario #1: I plan to sell USD/JPY today only after a break below 144.27 (red line on the chart), which would lead to a quick decline in the pair. The key target for sellers will be 143.90, where I intend to exit short positions and immediately open long positions in the opposite direction (aiming for a 20–25 pip bounce). Selling pressure on the pair could quickly return today.
Important! Before selling, ensure the MACD indicator is below the zero line and is just starting to decline from it.
Scenario #2: I also plan to sell USD/JPY today in the event of two consecutive tests of the 144.52 level, when the MACD indicator is in the overbought zone. This will limit the pair's upside potential and lead to a downward reversal. A decline toward the opposite levels of 144.27 and 143.90 can be expected.
What's on the Chart:
- The thin green line represents the entry price where the trading instrument can be bought.
- The thick green line indicates the expected price level where a Take Profit order can be placed, or profits can be manually secured, as further price growth above this level is unlikely.
- The thin red line represents the entry price where the trading instrument can be sold.
- The thick red line indicates the expected price level where a Take Profit order can be placed, or profits can be manually secured, as further price decline below this level is unlikely.
- The MACD indicator should be used to assess overbought and oversold zones when entering the market.
Important Notes:
- Beginner Forex traders should exercise extreme caution when making market entry decisions. It is advisable to stay out of the market before the release of important fundamental reports to avoid exposure to sharp price fluctuations. If you choose to trade during news releases, always use stop-loss orders to minimize potential losses. Trading without stop-loss orders can quickly wipe out your entire deposit, especially if you neglect money management principles and trade with high volumes.
- Remember, successful trading requires a well-defined trading plan, similar to the one outlined above. Making impulsive trading decisions based on the current market situation is a losing strategy for intraday traders.