


signal strength 1 of 5
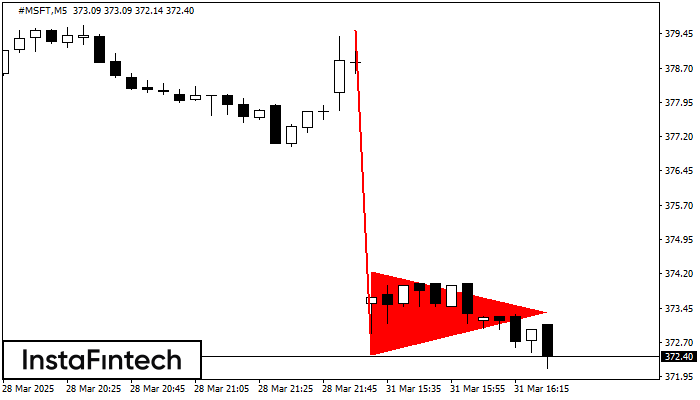
The Bearish pennant pattern has formed on the #MSFT M5 chart. The pattern signals continuation of the downtrend in case the pennant’s low of 372.44 is broken through. Recommendations: Place the sell stop pending order 10 pips below the pattern’s low. Place the take profit order at the projection distance of the flagpole height.
The M5 and M15 time frames may have more false entry points.
- All
- Double Top
- Flag
- Head and Shoulders
- Pennant
- Rectangle
- Triangle
- Triple top
- All
- #AAPL
- #AMZN
- #Bitcoin
- #EBAY
- #FB
- #GOOG
- #INTC
- #KO
- #MA
- #MCD
- #MSFT
- #NTDOY
- #PEP
- #TSLA
- #TWTR
- AUDCAD
- AUDCHF
- AUDJPY
- AUDUSD
- EURCAD
- EURCHF
- EURGBP
- EURJPY
- EURNZD
- EURRUB
- EURUSD
- GBPAUD
- GBPCHF
- GBPJPY
- GBPUSD
- GOLD
- NZDCAD
- NZDCHF
- NZDJPY
- NZDUSD
- SILVER
- USDCAD
- USDCHF
- USDJPY
- USDRUB
- All
- M5
- M15
- M30
- H1
- D1
- All
- Buy
- Sale
- All
- 1
- 2
- 3
- 4
- 5
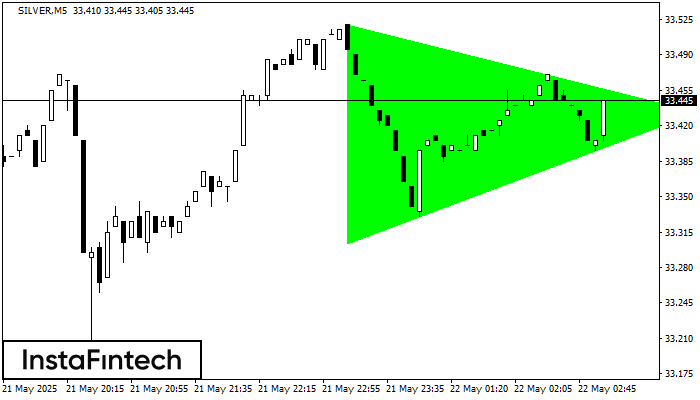
Según el gráfico de M5, SILVER formó el patrón Triángulo Simétrico Alcista, que señala que la tendencia continuará. Descripción. El límite superior del patrón toca las coordenadas 33.52/33.43 donde
Los marcos de tiempo M5 y M15 pueden tener más puntos de entrada falsos.
Open chart in a new window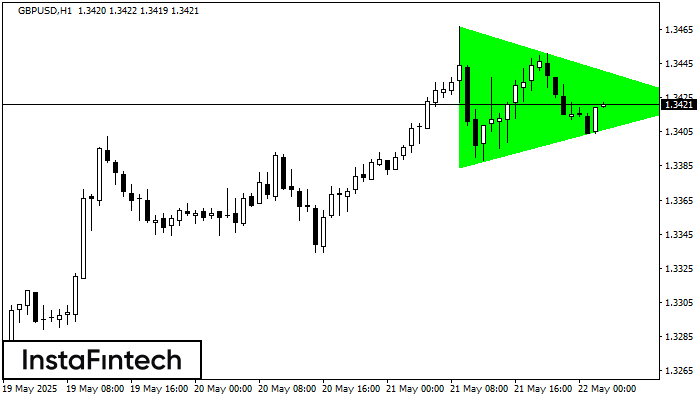
Según el gráfico de H1, GBPUSD formó el patrón Triángulo Simétrico Alcista. Descripción: Este es el patrón de la continuación de una tendencia. 1.3467 y 1.3384 son las coordenadas
Open chart in a new window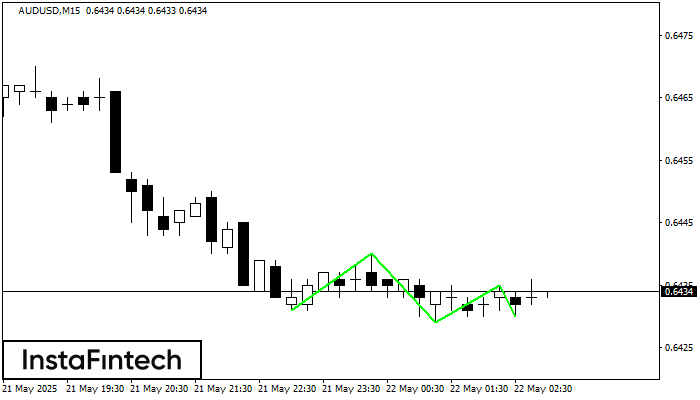
El patrón Triple Piso ha sido formado en AUDUSD M15. Este tiene las siguientes características: nivel de resistencia 0.6440/0.6435; nivel de soporte 0.6431/0.6430; el ancho es 9 puntos. En caso
Los marcos de tiempo M5 y M15 pueden tener más puntos de entrada falsos.
Open chart in a new window


