signal strength 2 of 5
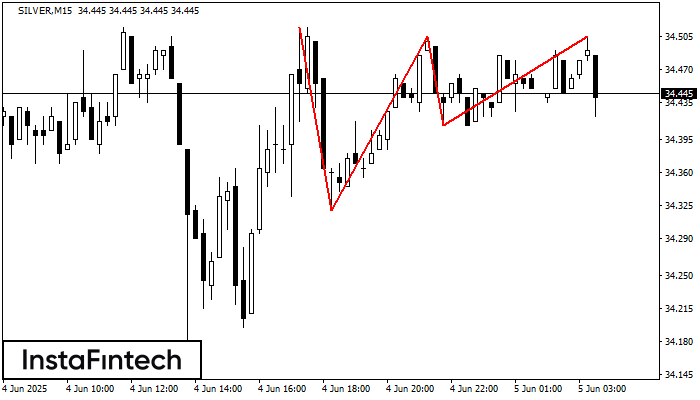
The Triple Top pattern has formed on the chart of the SILVER M15. Features of the pattern: borders have an ascending angle; the lower line of the pattern has the coordinates 34.32/34.41 with the upper limit 34.52/34.51; the projection of the width is 195 points. The formation of the Triple Top figure most likely indicates a change in the trend from upward to downward. This means that in the event of a breakdown of the support level of 34.32, the price is most likely to continue the downward movement.
The M5 and M15 time frames may have more false entry points.
Vea asimismo
- All
- Double Top
- Flag
- Head and Shoulders
- Pennant
- Rectangle
- Triangle
- Triple top
- All
- #AAPL
- #AMZN
- #Bitcoin
- #EBAY
- #FB
- #GOOG
- #INTC
- #KO
- #MA
- #MCD
- #MSFT
- #NTDOY
- #PEP
- #TSLA
- #TWTR
- AUDCAD
- AUDCHF
- AUDJPY
- AUDUSD
- EURCAD
- EURCHF
- EURGBP
- EURJPY
- EURNZD
- EURRUB
- EURUSD
- GBPAUD
- GBPCHF
- GBPJPY
- GBPUSD
- GOLD
- NZDCAD
- NZDCHF
- NZDJPY
- NZDUSD
- SILVER
- USDCAD
- USDCHF
- USDJPY
- USDRUB
- All
- M5
- M15
- M30
- H1
- D1
- All
- Buy
- Sale
- All
- 1
- 2
- 3
- 4
- 5

El patrón Triple Piso ha sido formado en GOLD M5. Este tiene las siguientes características: nivel de resistencia 3372.86/3370.25; nivel de soporte 3364.73/3364.26; el ancho es 813 puntos. En caso
Los marcos de tiempo M5 y M15 pueden tener más puntos de entrada falsos.
Open chart in a new window
Según el gráfico de M15, #GOOG formó el Rectángulo Bajista. El patrón indica la continuación de una tendencia. El límite superior es 170.41, el límite inferior es 169.00. La señal
Los marcos de tiempo M5 y M15 pueden tener más puntos de entrada falsos.
Open chart in a new window
Según el gráfico de M5, el #TSLA formó el patrón Triángulo Simétrico Bajista. Este patrón señala una tendencia bajista en caso de que el límite inferior 317.55 sea roto. Aquí
Los marcos de tiempo M5 y M15 pueden tener más puntos de entrada falsos.
Open chart in a new window