M5 chart of EUR/USD
Trading EUR/USD was quite inconvenient on Monday. Last week we repeatedly mentioned that the euro's movements made no sense and that its inconsistency with the fundamental and macroeconomic background contradicts any logic. On Monday, however, the pair tried to match the published reports, but EUR/USD radically changed its direction several times because of such reports. Nonetheless, it still entered a correction. We can mark out the retail sales in the European Union as well as the ISM service sector index in the US out of all the reports released on Monday. These reports triggered the most apparent market reactions. The retail sales report turned out to be too weak, so the euro was falling. The ISM index was surprisingly strong and so the dollar rose. So all in all, by the end of the day we can say that the dollar grew for the right reasons. We can only hope that from now on the pair would move according to the news.
As for trading signals, the situation was not the worst, but it certainly was not the best either. Basically, there were only three trading signals, all three - near the level of 1.0579, and all three turned out to be false. In the first case, the pair passed the sufficient distance to the downside, so traders set the Stop Loss to Breakeven, which was used to close the deal. In the second case, the buy signal was obviously false, and the deal was closed with some loss, when the price was lower than 1.0579. The third signal could not be used, though it could bring some profit to traders.
COT report
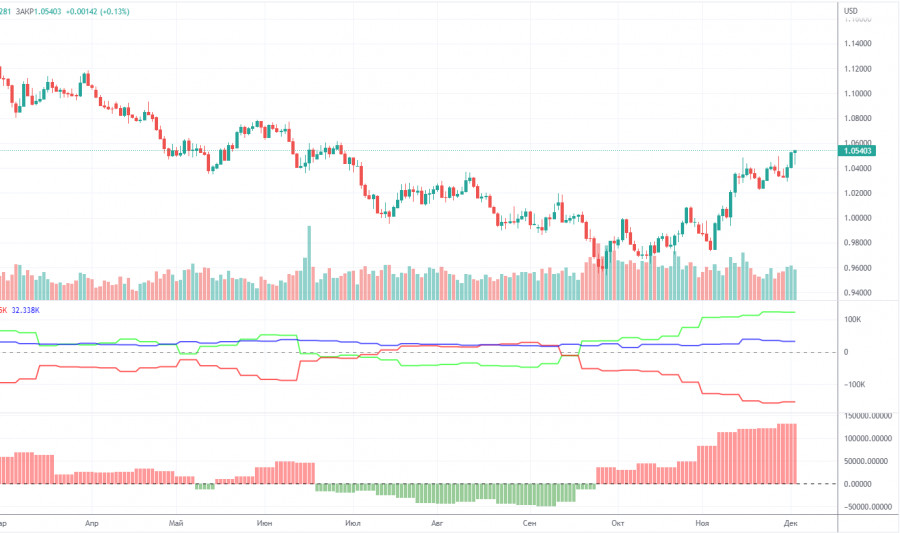
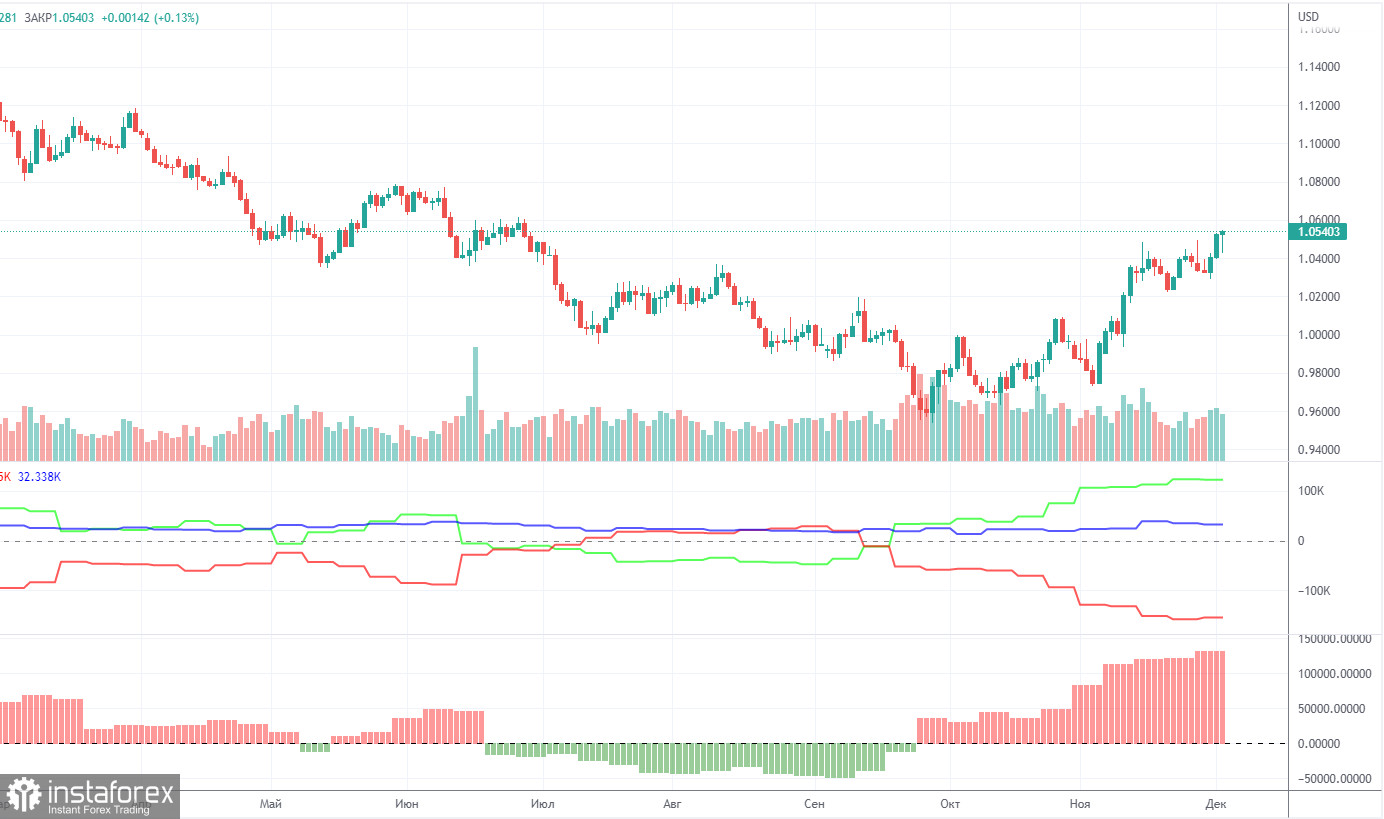
COT reports on EUR/USD have puzzled traders through most of 2022. Half of the year, COT reports indicated clear-cut bullish sentiment among large market makers while the single European currency was extending its weakness. For a few months, the reports showed a bearish sentiment and the euro was also trading lower. Now sentiment of non-commercial traders is turning bullish again, and the euro is rising, but it is a rather high net position that allows us to assume that the upward movement will end soon. During the reporting week, the number of Buy contracts for the Non-commercial group increased by 4,700, and the number of short contracts rose by 4,600. Accordingly, the net position grew by about 100 contracts. The European currency has been rising in recent weeks, which is already in line with the readings of the COT reports. At the same time, we believe that the US currency may still regain its footing amid the same geopolitics or due to the lack of fundamentals for further growth of the euro. The green and red lines of the first indicator moved far away from each other, which could mean the end of the uptrend (!!!) (which, in fact, never happened).
The number of BUY contracts is higher than the number of SELL contracts for non-commercial traders by 133,000. Thus, the net position of the "non-commercial" group may continue to rise further, but this may not trigger a similar rise in the euro. If we look at the overall numbers of open long and short contracts for all categories of traders, there are 33,000 more sell contracts (755,000 vs. 723,000).
H1 chart of EUR/USD
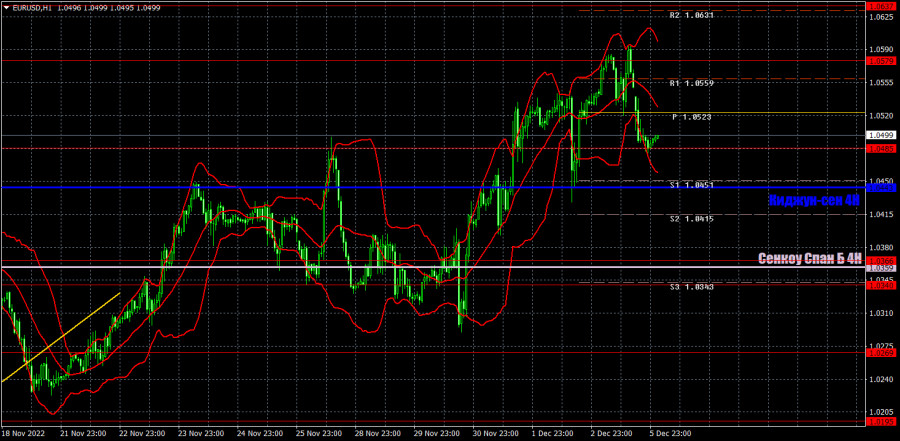
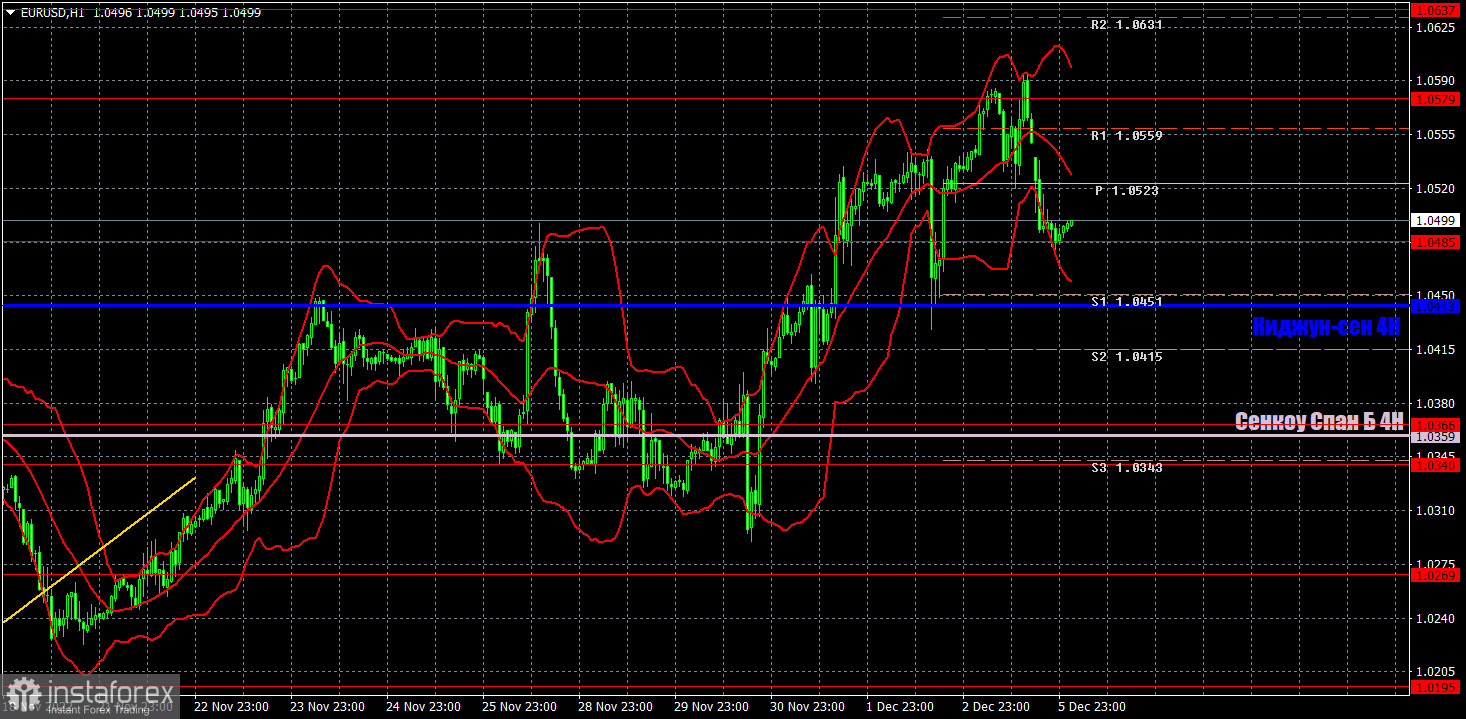
On the one-hour chart, EUR/USD tried to start a bearish correction, which I have been waiting for the past few weeks. However, the price is still above the Ichimoku indicator, so it might end up with a pullback. There will not be much news and reports this week, so traders are left on their own again and their sentiment will not be influenced by macroeconomics or fundamentals. On Tuesday, the pair may trade at the following levels: 1.0195, 1.0269, 1.0340-1.0366, 1.0485, 1.0579, 1.0637, as well as Senkou Span B (1.0359) and Kijun Sen (1.0441). Lines of the Ichimoku indicator may move during the day, which should be taken into account when determining trading signals. There are also support and resistance levels, but signals are not formed near these levels. Bounces and breakouts of the extreme levels and lines could act as signals. Don't forget about stop-loss orders, if the price covers 15 pips in the right direction. This will prevent you from losses in case of a false signal. On December 6, there are no important reports or events in the EU and the US. Nevertheless, we expect a correction or at least a trend during the day. As usual, the strongest movement might come during the US trading session.
What we see on the trading charts:
Price levels of support and resistance are thick red lines, near which the movement may end. They do not provide trading signals.
The Kijun-sen and Senkou Span B lines are the lines of the Ichimoku indicator, moved to the one-hour chart from the 4-hour one. They are strong lines.
Extreme levels are thin red lines from which the price bounced earlier. They provide trading signals.
Yellow lines are trend lines, trend channels, and any other technical patterns.
Indicator 1 on the COT charts reflects the net position size of each category of traders.
Indicator 2 on the COT charts reflects the net position size for the non-commercial group.