signal strength 4 of 5
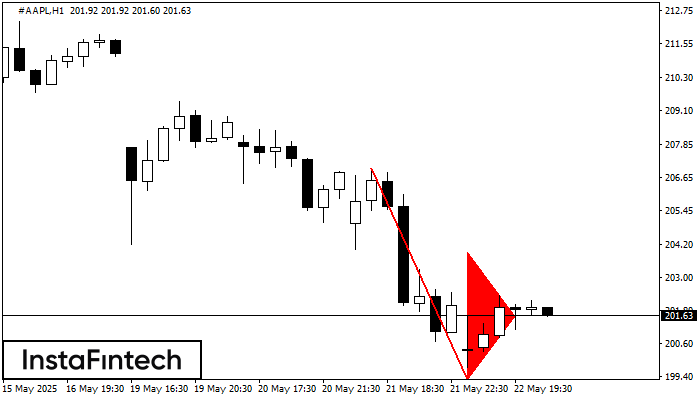
The Bearish pennant pattern has formed on the #AAPL H1 chart. It signals potential continuation of the existing trend. Specifications: the pattern’s bottom has the coordinate of 199.24; the projection of the flagpole height is equal to 776 pips. In case the price breaks out the pattern’s bottom of 199.24, the downtrend is expected to continue for further level 198.84.
See Also
- All
- Double Top
- Flag
- Head and Shoulders
- Pennant
- Rectangle
- Triangle
- Triple top
- All
- #AAPL
- #AMZN
- #Bitcoin
- #EBAY
- #FB
- #GOOG
- #INTC
- #KO
- #MA
- #MCD
- #MSFT
- #NTDOY
- #PEP
- #TSLA
- #TWTR
- AUDCAD
- AUDCHF
- AUDJPY
- AUDUSD
- EURCAD
- EURCHF
- EURGBP
- EURJPY
- EURNZD
- EURRUB
- EURUSD
- GBPAUD
- GBPCHF
- GBPJPY
- GBPUSD
- GOLD
- NZDCAD
- NZDCHF
- NZDJPY
- NZDUSD
- SILVER
- USDCAD
- USDCHF
- USDJPY
- USDRUB
- All
- M5
- M15
- M30
- H1
- D1
- All
- Buy
- Sale
- All
- 1
- 2
- 3
- 4
- 5
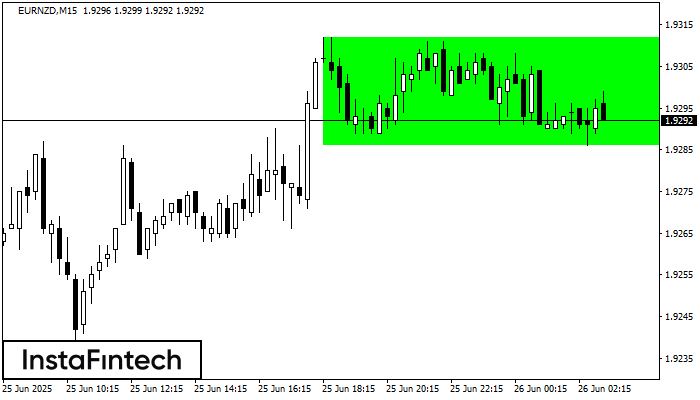
According to the chart of M15, EURNZD formed the Bullish Rectangle. This type of a pattern indicates a trend continuation. It consists of two levels: resistance 1.9312 and support 1.9286
The M5 and M15 time frames may have more false entry points.
Open chart in a new window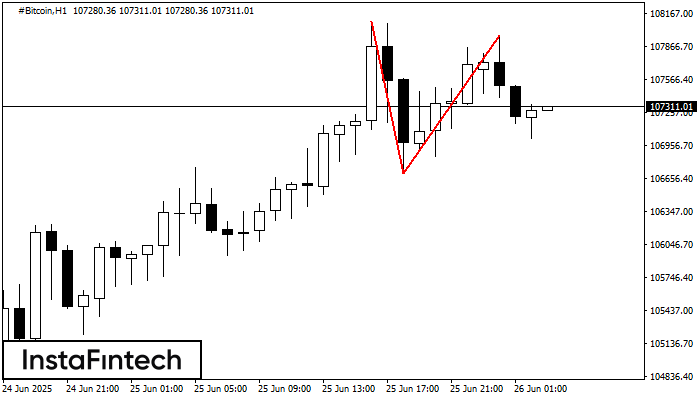
On the chart of #Bitcoin H1 the Double Top reversal pattern has been formed. Characteristics: the upper boundary 107966.41; the lower boundary 106699.67; the width of the pattern 126674 points
Open chart in a new window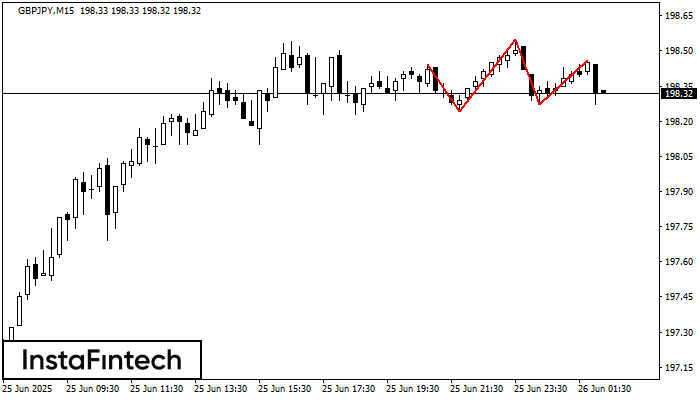
The technical pattern called Head and Shoulders has appeared on the chart of GBPJPY M15. There are weighty reasons to suggest that the price will surpass the Neckline 198.24/198.27 after
The M5 and M15 time frames may have more false entry points.
Open chart in a new window