signal strength 1 of 5
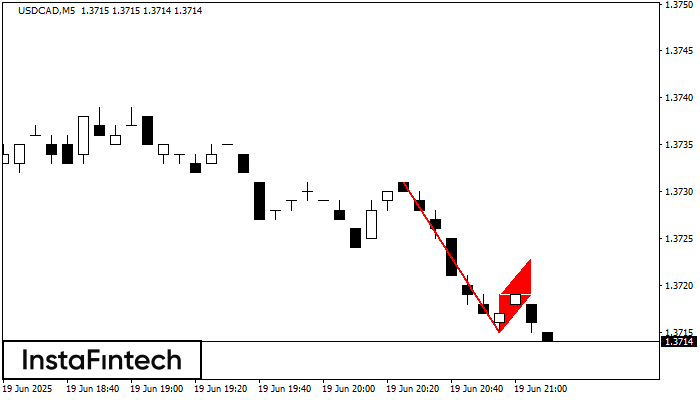
The Bearish Flag pattern has been formed on USDCAD at M5. The lower boundary of the pattern is located at 1.3715/1.3719 while the upper boundary lies at 1.3719/1.3723. The projection of the flagpole is 16 points. This formation signals that the downward trend is most likely to continue. Therefore, if the level of 1.3715 is broken, the price will move further downwards.
The M5 and M15 time frames may have more false entry points.
See Also
- All
- Double Top
- Flag
- Head and Shoulders
- Pennant
- Rectangle
- Triangle
- Triple top
- All
- #AAPL
- #AMZN
- #Bitcoin
- #EBAY
- #FB
- #GOOG
- #INTC
- #KO
- #MA
- #MCD
- #MSFT
- #NTDOY
- #PEP
- #TSLA
- #TWTR
- AUDCAD
- AUDCHF
- AUDJPY
- AUDUSD
- EURCAD
- EURCHF
- EURGBP
- EURJPY
- EURNZD
- EURRUB
- EURUSD
- GBPAUD
- GBPCHF
- GBPJPY
- GBPUSD
- GOLD
- NZDCAD
- NZDCHF
- NZDJPY
- NZDUSD
- SILVER
- USDCAD
- USDCHF
- USDJPY
- USDRUB
- All
- M5
- M15
- M30
- H1
- D1
- All
- Buy
- Sale
- All
- 1
- 2
- 3
- 4
- 5
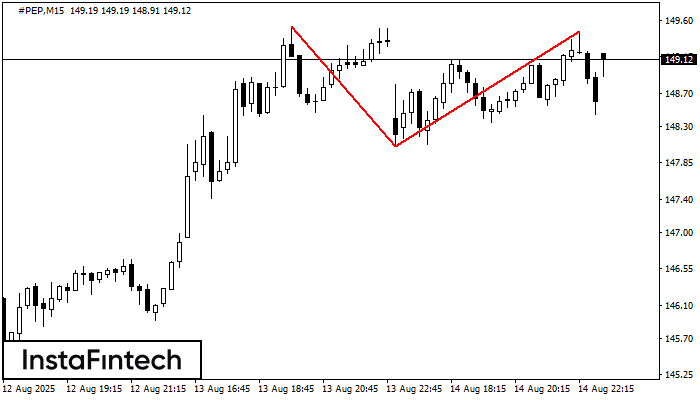
On the chart of #PEP M15 the Double Top reversal pattern has been formed. Characteristics: the upper boundary 149.46; the lower boundary 148.05; the width of the pattern 141 points
The M5 and M15 time frames may have more false entry points.
Open chart in a new window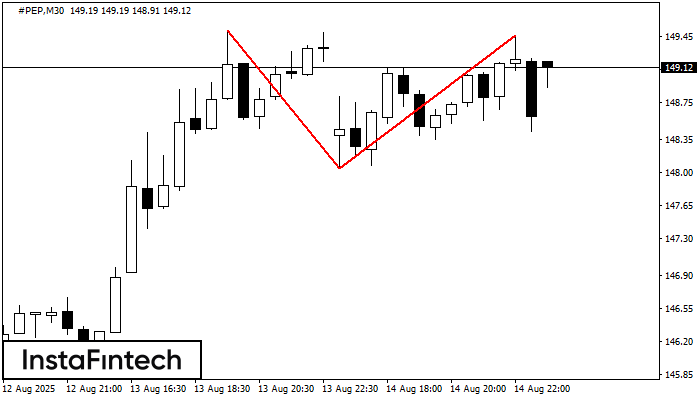
On the chart of #PEP M30 the Double Top reversal pattern has been formed. Characteristics: the upper boundary 149.46; the lower boundary 148.05; the width of the pattern 141 points
Open chart in a new window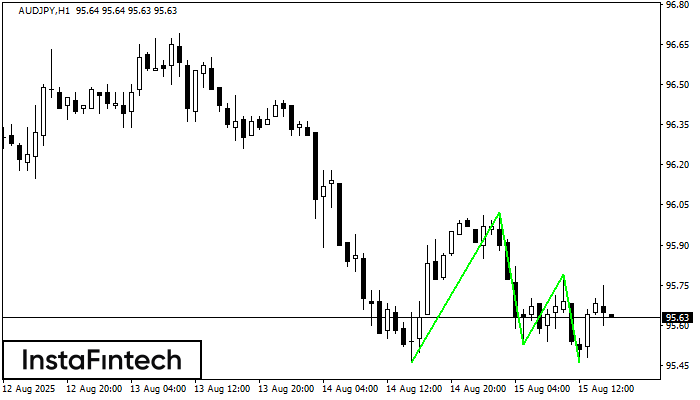
The Triple Bottom pattern has formed on the chart of AUDJPY H1. Features of the pattern: The lower line of the pattern has coordinates 96.02 with the upper limit 96.02/95.79
Open chart in a new window