


signal strength 1 of 5
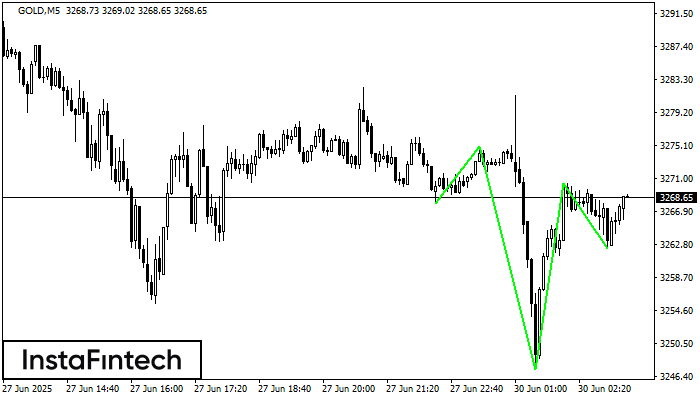
According to the chart of M5, GOLD produced the pattern termed the Inverse Head and Shoulder. The Head is fixed at 3247.25 while the median line of the Neck is set at 3275.01/3270.41. The formation of the Inverse Head and Shoulder Pattern clearly indicates a reversal of the downward trend. In means that in case the scenario comes true, the price of GOLD will go towards 3270.56.
The M5 and M15 time frames may have more false entry points.
- All
- Double Top
- Flag
- Head and Shoulders
- Pennant
- Rectangle
- Triangle
- Triple top
- All
- #AAPL
- #AMZN
- #Bitcoin
- #EBAY
- #FB
- #GOOG
- #INTC
- #KO
- #MA
- #MCD
- #MSFT
- #NTDOY
- #PEP
- #TSLA
- #TWTR
- AUDCAD
- AUDCHF
- AUDJPY
- AUDUSD
- EURCAD
- EURCHF
- EURGBP
- EURJPY
- EURNZD
- EURRUB
- EURUSD
- GBPAUD
- GBPCHF
- GBPJPY
- GBPUSD
- GOLD
- NZDCAD
- NZDCHF
- NZDJPY
- NZDUSD
- SILVER
- USDCAD
- USDCHF
- USDJPY
- USDRUB
- All
- M5
- M15
- M30
- H1
- D1
- All
- Buy
- Sale
- All
- 1
- 2
- 3
- 4
- 5
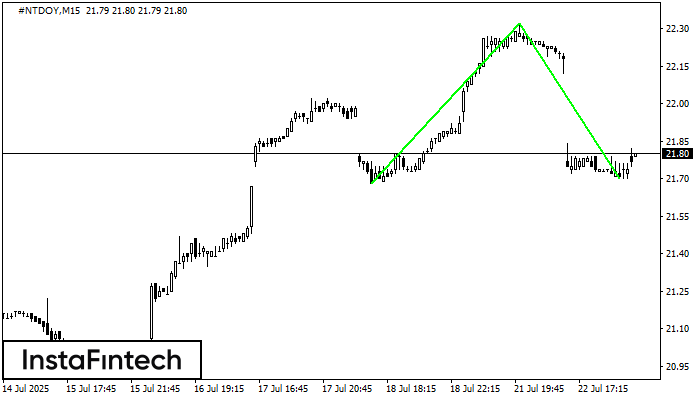
The Double Bottom pattern has been formed on #NTDOY M15; the upper boundary is 22.32; the lower boundary is 21.70. The width of the pattern is 64 points. In case
The M5 and M15 time frames may have more false entry points.
Open chart in a new window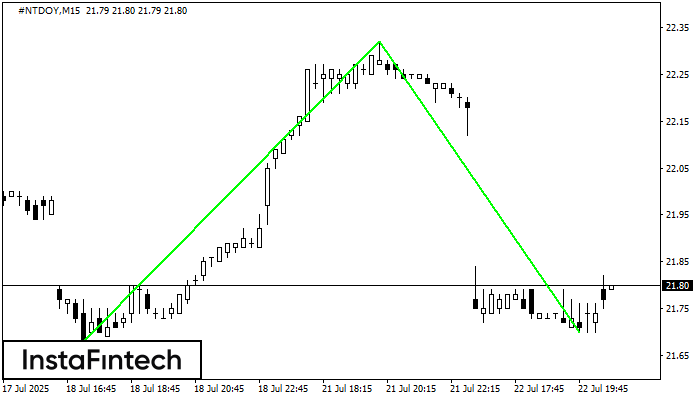
The Double Bottom pattern has been formed on #NTDOY M15. Characteristics: the support level 21.68; the resistance level 22.32; the width of the pattern 64 points. If the resistance level
The M5 and M15 time frames may have more false entry points.
Open chart in a new window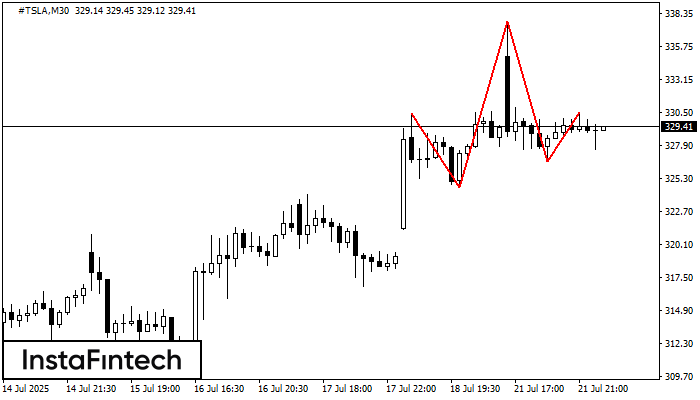
The #TSLA M30 formed the Head and Shoulders pattern with the following features: The Head’s top is at 337.71, the Neckline and the upward angle are at 324.60/326.66. The formation
Open chart in a new window


