

signal strength 1 of 5
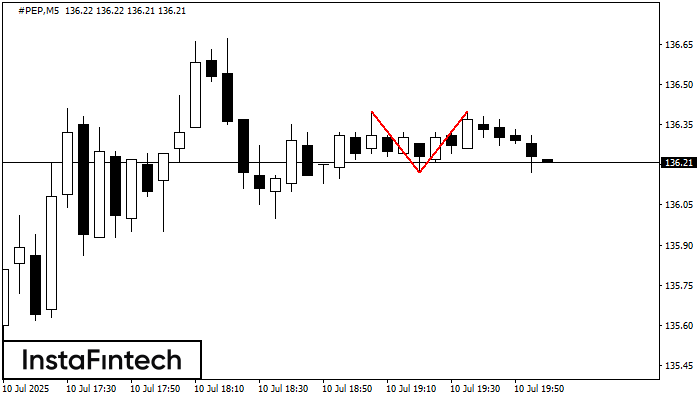
On the chart of #PEP M5 the Double Top reversal pattern has been formed. Characteristics: the upper boundary 136.40; the lower boundary 136.17; the width of the pattern 23 points. The signal: a break of the lower boundary will cause continuation of the downward trend targeting the 136.02 level.
The M5 and M15 time frames may have more false entry points.
See Also
- All
- Double Top
- Flag
- Head and Shoulders
- Pennant
- Rectangle
- Triangle
- Triple top
- All
- #AAPL
- #AMZN
- #Bitcoin
- #EBAY
- #FB
- #GOOG
- #INTC
- #KO
- #MA
- #MCD
- #MSFT
- #NTDOY
- #PEP
- #TSLA
- #TWTR
- AUDCAD
- AUDCHF
- AUDJPY
- AUDUSD
- EURCAD
- EURCHF
- EURGBP
- EURJPY
- EURNZD
- EURRUB
- EURUSD
- GBPAUD
- GBPCHF
- GBPJPY
- GBPUSD
- GOLD
- NZDCAD
- NZDCHF
- NZDJPY
- NZDUSD
- SILVER
- USDCAD
- USDCHF
- USDJPY
- USDRUB
- All
- M5
- M15
- M30
- H1
- D1
- All
- Buy
- Sale
- All
- 1
- 2
- 3
- 4
- 5
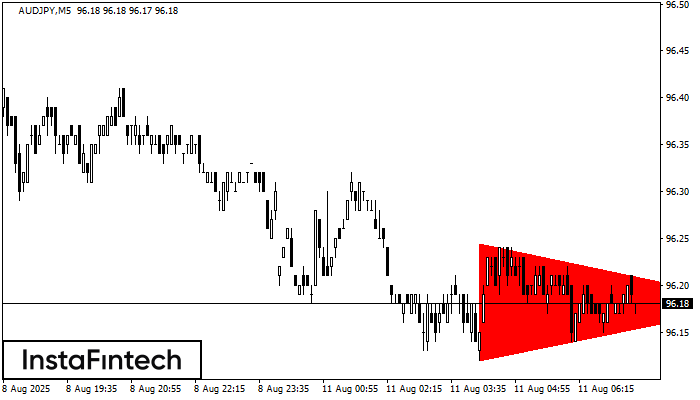
Según el gráfico de M5, el AUDJPY formó el patrón Triángulo Simétrico Bajista. Descripción: El límite inferior es 96.12/96.18 y el límite superior es 96.24/96.18. El ancho del patrón
Los marcos de tiempo M5 y M15 pueden tener más puntos de entrada falsos.
Open chart in a new window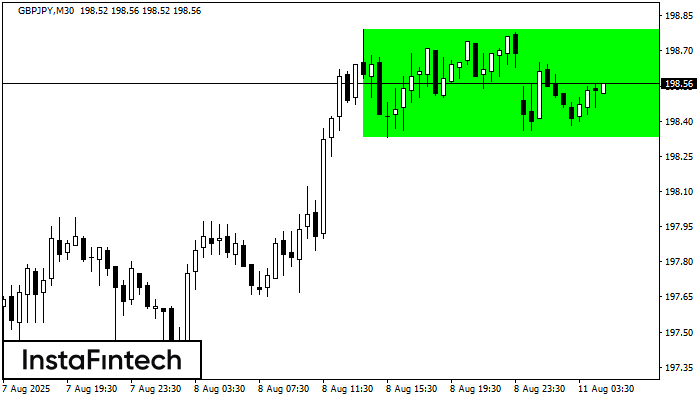
Según el gráfico de M30, GBPJPY formó el Rectángulo Alcista. El patrón indica la continuación de una tendencia. El límite superior es 198.79, el límite inferior es 198.33. La señal
Open chart in a new window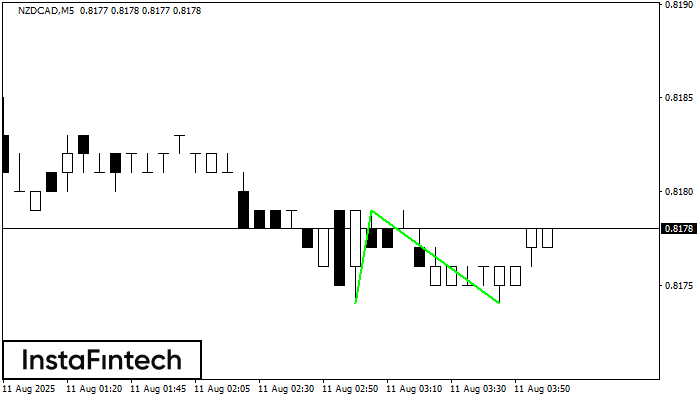
El patrón Doble Piso ha sido formado en NZDCAD M5. Esta formación señala una reversión de la tendencia de bajista a alcista. La señal es que se debe abrir
Los marcos de tiempo M5 y M15 pueden tener más puntos de entrada falsos.
Open chart in a new window


