signal strength 4 of 5
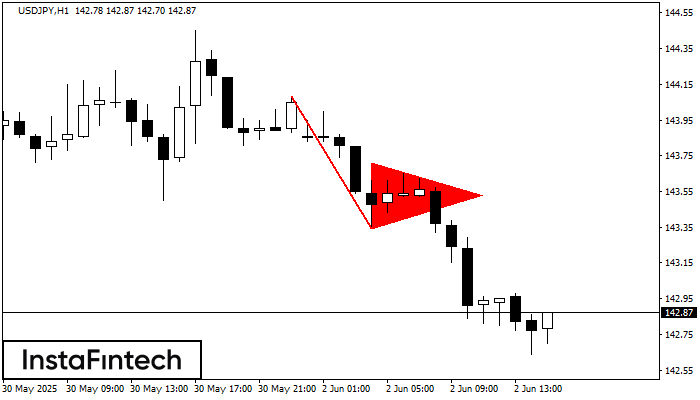
The Bearish pennant pattern has formed on the USDJPY H1 chart. It signals potential continuation of the existing trend. Specifications: the pattern’s bottom has the coordinate of 143.34; the projection of the flagpole height is equal to 74 pips. In case the price breaks out the pattern’s bottom of 143.34, the downtrend is expected to continue for further level 142.94.
See Also
- All
- Double Top
- Flag
- Head and Shoulders
- Pennant
- Rectangle
- Triangle
- Triple top
- All
- #AAPL
- #AMZN
- #Bitcoin
- #EBAY
- #FB
- #GOOG
- #INTC
- #KO
- #MA
- #MCD
- #MSFT
- #NTDOY
- #PEP
- #TSLA
- #TWTR
- AUDCAD
- AUDCHF
- AUDJPY
- AUDUSD
- EURCAD
- EURCHF
- EURGBP
- EURJPY
- EURNZD
- EURRUB
- EURUSD
- GBPAUD
- GBPCHF
- GBPJPY
- GBPUSD
- GOLD
- NZDCAD
- NZDCHF
- NZDJPY
- NZDUSD
- SILVER
- USDCAD
- USDCHF
- USDJPY
- USDRUB
- All
- M5
- M15
- M30
- H1
- D1
- All
- Buy
- Sale
- All
- 1
- 2
- 3
- 4
- 5
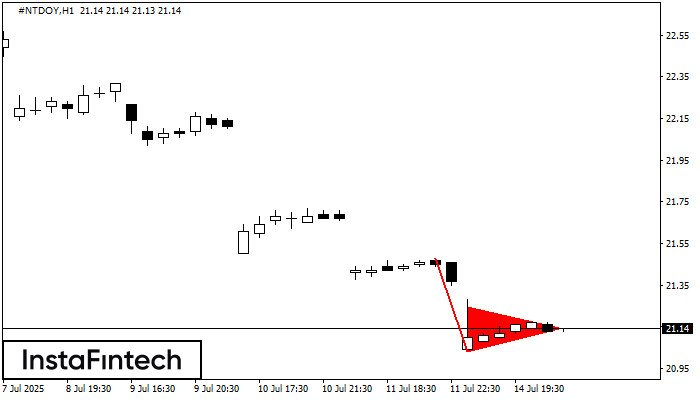
Corak Pennant Aliran Menurun telah dibentuk pada carta #NTDOY H1. Jenis corak ini dicirikan oleh sedikit penurunan di mana selepas itu harga akan bergerak ke arah aliran asal. Sekiranya harga
Open chart in a new window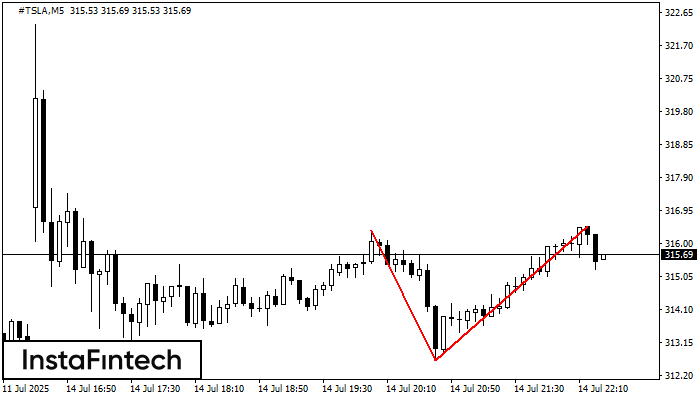
Corak Double Top telah dibentuk pada #TSLA M5. Isyarat bahawa aliran telah berubah dari aliran menaik ke aliran menurun. Mungkin, sekiranya asas corak 312.63 ditembusi, pergerakan menurun akan berterusan
Carta masa M5 dan M15 mungkin mempunyai lebih banyak titik kemasukan palsu.
Open chart in a new window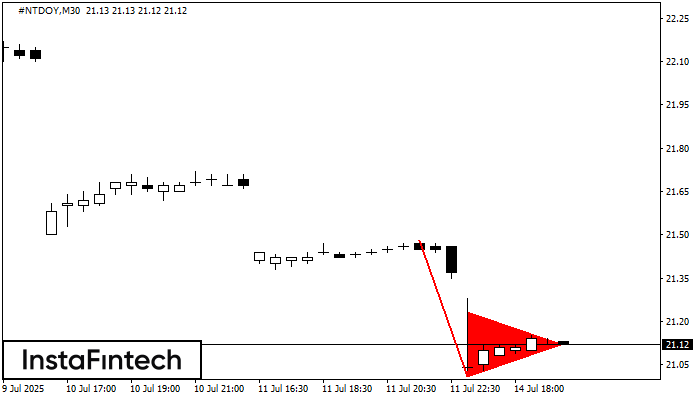
Corak Pennant Aliran Menurun telah dibentuk pada carta #NTDOY M30. Jenis corak ini dicirikan oleh sedikit penurunan di mana selepas itu harga akan bergerak ke arah aliran asal. Sekiranya harga
Open chart in a new window