empty
08.02.2022 03:03 PM
Elliottwave update on Oil prices.

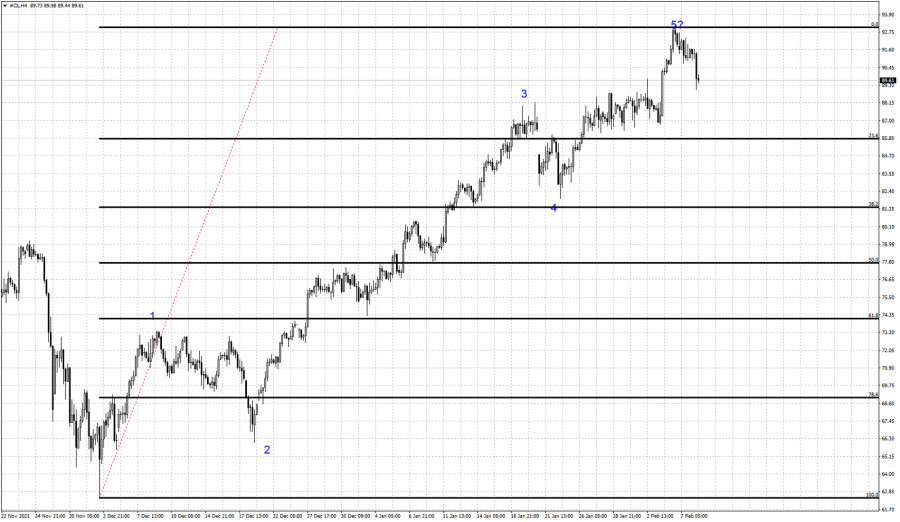
Last week we posted our analysis on Oil prices using our Elliottwave count warning that the upside in Oil prices is limited and that traders should prepare for a major pull back. There is still no confirmation of such a pull back starting, technically trend remains bullish. However we need to focus on specific key levels that will help us reach a conclusion sooner.

This image is no longer relevant

Black lines- Fibonacci retracements

Blue numbers - Elliott wave count

Price technically remains in a bullish trend as price is making higher highs and higher lows. Our most probable scenario using the Elliottwave theory, tells us that we are currently on the 5th and final wave of the rise from the $62 lows. The 5th wave could very well be over but we are not sure yet. The recent low at $86.75 is the key price level we are talking about. As long as price is above it, price can continue to move higher to new highs. If price breaks below it, then we will be very confident that the entire upward movement is over and at least a short-term pull back will start. The first short-term pull back target would at $81.40 if price does not make new higher highs. Concluding, our view remains the same, bulls remain in control but they have to be very cautious as we continue to believe we are near the end of this trend.

Select timeframe
5
min
15
min
30
min
1
hour
4
hours
1
day
1
week
Earn on cryptocurrency rate changes with InstaForex
Download MetaTrader 4 and open your first trade
  • Grand Choice
    Contest by
    InstaForex
    InstaForex always strives to help you
    fulfill your biggest dreams.
    JOIN CONTEST

Recommended Stories

Analysis of EUR/USD on June 5, 2025

The wave pattern on the 4-hour chart for the EUR/USD pair has transformed into an upward structure and continues to maintain this formation. I believe there is little doubt that

Chin Zhao 20:03 2025-06-05 UTC+2

GBP/USD Analysis on June 4, 2025

The wave pattern for GBP/USD continues to indicate the formation of an upward impulsive wave structure. The wave picture is almost identical to that of the EUR/USD pair. Until February

Chin Zhao 18:48 2025-06-04 UTC+2

EUR/USD Analysis on June 3, 2025

The wave pattern on the 4-hour chart for EUR/USD has transformed into an upward structure and remains such. I believe there's no doubt that this transformation occurred exclusively

Chin Zhao 19:38 2025-06-03 UTC+2

GBP/USD Analysis on June 3, 2025

The wave structure for GBP/USD continues to indicate the development of an upward impulsive wave pattern. The wave pattern is almost identical to that of the EUR/USD pair. Until February

Chin Zhao 19:32 2025-06-03 UTC+2

EUR/USD Analysis on June 2, 2025

The wave structure on the 4-hour chart for EUR/USD has transformed into a bullish formation and continues to hold that shape. I believe there is no doubt that this transformation

Chin Zhao 19:07 2025-06-02 UTC+2

GBP/USD Analysis on June 2, 2025

The wave structure for GBP/USD continues to indicate the formation of a bullish impulse wave pattern. The wave pattern closely mirrors that of EUR/USD. Until February 28, we observed

Chin Zhao 19:05 2025-06-02 UTC+2

Weekly Forecast Based on Simplified Wave Analysis for GBP/USD, AUD/USD, USD/CHF, EUR/JPY, EUR/GBP, and the US Dollar Index on June 2nd

During the upcoming week, the British pound is expected to move from its current zone toward the calculated resistance area. In the early days, a downward vector with potential pressure

Isabel Clark 11:53 2025-06-02 UTC+2

Weekly Forecast Based on Simplified Wave Analysis for EUR/USD, USD/JPY, GBP/JPY, USD/CAD, NZD/USD, and Gold on June 2nd

In the coming days, the euro is expected to continue moving sideways. A short-term decline toward the support zone is possible. Afterward, conditions for a reversal may form. The start

Isabel Clark 11:48 2025-06-02 UTC+2

GBP/USD Analysis on May 30, 2025

The wave structure for GBP/USD continues to indicate the development of an upward impulsive wave pattern. The wave pattern is almost identical to that of EUR/USD. Until February

Chin Zhao 17:31 2025-05-30 UTC+2

EUR/USD Analysis on May 29, 2025

The wave pattern on the 4-hour chart for EUR/USD has transformed into an upward structure and remains so. It is clear that this shift has occurred solely

Chin Zhao 20:18 2025-05-29 UTC+2
Can't speak right now?
Ask your question in the chat.
Widget callback
 

Dear visitor,

Your IP address shows that you are currently located in the USA. If you are a resident of the United States, you are prohibited from using the services of InstaFintech Group including online trading, online transfers, deposit/withdrawal of funds, etc.

If you think you are seeing this message by mistake and your location is not the US, kindly proceed to the website. Otherwise, you must leave the website in order to comply with government restrictions.

Why does your IP address show your location as the USA?

  • - you are using a VPN provided by a hosting company based in the United States;
  • - your IP does not have proper WHOIS records;
  • - an error occurred in the WHOIS geolocation database.

Please confirm whether you are a US resident or not by clicking the relevant button below. If you choose the wrong option, being a US resident, you will not be able to open an account with InstaForex anyway.

We are sorry for any inconvenience caused by this message.